The natural gas markets went back and forth during the day on Friday, testing the $3.00 level above. If we can break above that level, then I think the
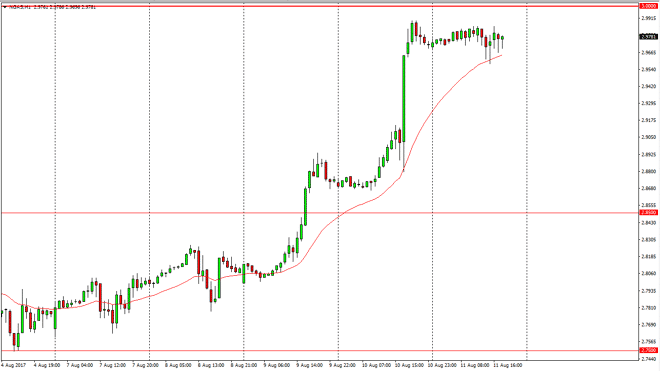
The natural gas markets went back and forth during the day on Friday, testing the $3.00 level above. If we can break above that level, then I think the resistance extends all the way to the 3.10 level above there. I don’t think that the market is going to have enough momentum to break out to the upside, and I believe it’s only a matter of time before the sellers return to this market as the oversupply will continue to be an issue. I think that the US dollar falling has been a little bit of a boon for this market, but given enough time I believe that the longer-term resistance will hold. Alternately, if we break down below the $2.95 level, I would be a seller of this market as well. This is a market that has seen a significant amount of bullish pressure over the last couple of sessions, but quite frankly I think it’s a bit overdone as the fundamentals of this market have not changed much.
Click here is you wish to join the prestigious club of Forex traders
Chris is a proprietary trader with more than 20 years of experience across various markets, including currencies, indices and commodities. As a senior analyst at FXEmpire since the website’s early days, he offers readers advanced market perspectives to navigate today’s financial landscape with confidence.