Natural gas markets initially tried to rally during the day on Friday, but then broke down significantly, reaching down to the $2.57 level. Ultimately, I believe that the market continues to see negativity, but rallies should offer selling opportunities.
The natural gas markets broke down significantly during the trading session on Friday, as it looks now like we are ready to down to the $2.50 handle. I think the $2.75 level above is significant resistance, so any time we rally between here and there, I’m looking for signs of exhaustion that I can start selling again. With this in mind, I think that the overall attitude of the market is going to continue to be negative, but if we break above the $2.75 level, it’s likely that we will see the $3.10 level offer massive resistance.
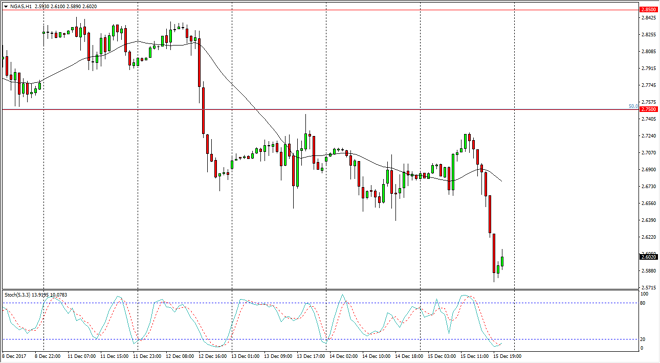
I think that the $2.50 level is essentially the “floor” in the market, but if we were to break down below there are things could give catastrophically negative. I think we will reach down to that area though, so that’s why in selling the rallies after this negativity. When you look at the hourly chart, I think that the oversold condition on the stochastic oscillator will eventually cause the market to bounce, but I think more than likely we get short-term selling, followed by intermediate positivity over the course of the next several sessions. Nonetheless, it looks as if the natural gas markets are in a significant amount of trouble.
Chris is a proprietary trader with more than 20 years of experience across various markets, including currencies, indices and commodities. As a senior analyst at FXEmpire since the website’s early days, he offers readers advanced market perspectives to navigate today’s financial landscape with confidence.