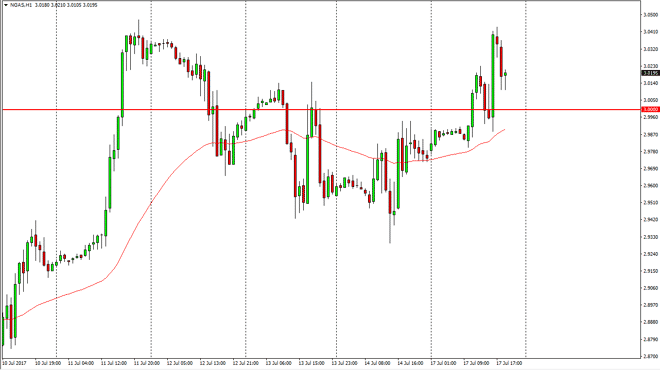
Natural gas markets rallied on Monday, breaking above the $3.00 level. This is a very significant move, but I would be remiss to suggest that we should
Natural gas markets rallied on Monday, breaking above the $3.00 level. This is a very significant move, but I would be remiss to suggest that we should start buying here. Although it looks bullish on the one-hour chart, I recognize that there is a lot of resistance near the $3.10 handle. Because of this, I believe that the sellers will return, and I will start shorting this market on the first signs of exhaustion. We don’t have that yet, so it’s probably best to sit on the sidelines over the next day or so. Alternately though, we could turn around and blast through the $3.00 level to the downside, which would have me selling. That would show a renewed vigor for selling, and I have course would have to follow that as it lines up well with the overall technical analysis.
As this market continues to chop around, remember it’s not the most liquid energy market, it’s probably best to wait for signs of exhaustion to go ahead and follow. This is a market that can rally quite significantly in short bursts, even in a downtrend. Because of this, I prefer small positions, but believe that sellers will continue to be rewarded time and time again as we go forward. Longer-term, I have a target of $2.75, followed by $2.50.
Chris is a proprietary trader with more than 20 years of experience across various markets, including currencies, indices and commodities. As a senior analyst at FXEmpire since the website’s early days, he offers readers advanced market perspectives to navigate today’s financial landscape with confidence.