The natural gas markets initially fell but found enough support near the $3 level to turn things around and break much higher. On top of that, we broke
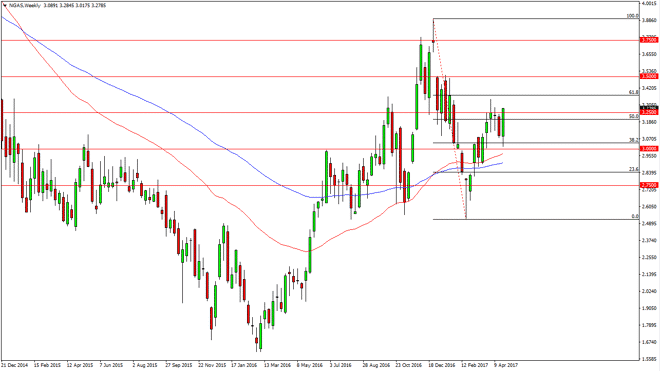
The natural gas markets initially fell but found enough support near the $3 level to turn things around and break much higher. On top of that, we broke above the $3.25 level, which is a psychological barrier. However, longer-term traders will have to be aware of the $3.33 level, and a break above there is needed for the longer term traders to hold onto a bullish move in the natural gas markets. This is probably more suited for short-term traders at the moment, although it certainly looks bullish.
Chris is a proprietary trader with more than 20 years of experience across various markets, including currencies, indices and commodities. As a senior analyst at FXEmpire since the website’s early days, he offers readers advanced market perspectives to navigate today’s financial landscape with confidence.