Natural gas markets went sideways initially during the trading session on Friday, and then rallied towards the $3.20 level. I think that some type of selloff is going to occur given enough time, based upon the longer-term charts.
The natural gas markets have gone sideways and then rally during the day on Friday. The $3.20 level has been an area of resistance, and I think they we will more than likely see the market tried again, but the longer-term charts have been extraordinarily negative once we get in this general vicinity, and I think that we will probably see a lot of volatility though, but the oversupply of natural gas will eventually catch up to the market. This past week, we had seen more demand than previously thought, but I think that the market will eventually be flooded by suppliers that have been holding back supply the futures market. These prices are strong enough for American fractures to make money, which is exactly what they have been waiting on.
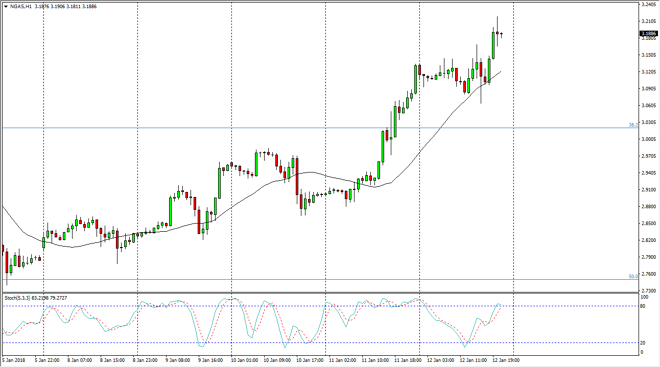
If we break above the $3.40 level, then it changes the overall downward attitude, but the last year has shown that every time it looks like we are ready to go higher, something always happens. I expect that to happen again, and it does look as if we are reaching towards the overbought position on the hourly chart, and possibly looking to cross over the moving averages. If that’s the case, I think that we will reach towards the $3.10 first, and then eventually the $3 level underneath. A breakdown below that level sends this market even lower, perhaps reaching down towards the $2.75 level over the longer term. Regardless what happens, it’s going to be choppy but I still preferred the down side.
Chris is a proprietary trader with more than 20 years of experience across various markets, including currencies, indices and commodities. As a senior analyst at FXEmpire since the website’s early days, he offers readers advanced market perspectives to navigate today’s financial landscape with confidence.