Weekly Analysis and Recommendation: October Natural Gas futures attempted to breakout to the upside last week, but bearish fundamental news once again
Weekly Analysis and Recommendation:
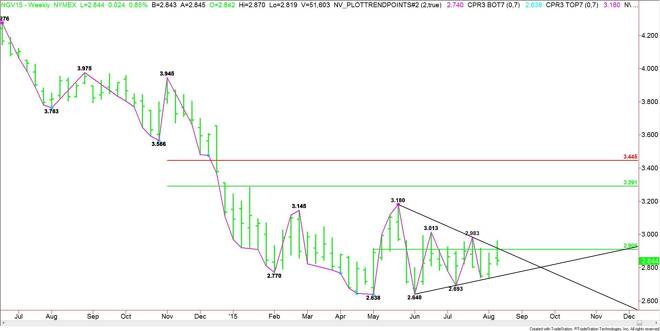
October Natural Gas futures attempted to breakout to the upside last week, but bearish fundamental news once again thwarted the effort. The market did close a little better for the week, but momentum may be shifting back to the downside since it closed on the weak side of the mid-point of its three month range.
Last week’s rally was brought to an end after the U.S. Energy Information Administration (EIA) reported that U.S. natural gas stocks increased by 65 billion cubic feet (Bcf) for the week-ending August 4. Analysts were looking for a storage injection of 55 billion cubic feet. The five-year average for the week is an increase of around 48 billion cubic feet, and last year’s addition for the week totaled 79 billion cubic feet.
This week’s data probably kept a lid on prices since stockpiles came in at about 21% above their levels of a year ago and about 3% above the five-year average. Naturally, if you look at the chart, you will see that the current price at $2.844 is substantially lower than last year’s $3.830 close the week-ending August 15, 2014.
Additionally, the EIA reported that U.S. working stocks of natural gas totaled about 2.977 trillion cubic feet, close to 81 billion cubic feet above the five-year average of 2.896 trillion cubic feet and 521 billion cubic feet above last year’s total for the same period. Working gas in storage totaled 2.456 trillion cubic feet for the same period a year ago.
Besides the weekly forecast, the EIA also issued a report highlighting its short-term projections. This report was also bearish because in it, the EIA is projecting that natural gas inventories will reach its second-highest level on record by October 31.
Gas inventories are projected to reach 3.867 Trillion cubic feet (Tcf) by the end of the summer refill season. This estimate puts end-of-season inventories at 69 Bcf above the five-year average.
The EIA also estimates monthly average spot prices to remain lower than $3/MMBtu through October, and lower than $4/MMBtu through the end of 2016.
FxEmpire provides in-depth analysis for each currency and commodity we review. Fundamental analysis is provided in three components. We provide a detailed monthly analysis and forecast at the beginning of each month. Then we provide more recent analysis and information in our weekly reports and we provide daily updates and outlooks.
AccuWeather US Forecast Outlook:
This week-end should bring above average temperatures to the Great Lakes region. The typical pattern across the United States for the middle of August features widespread heat and humidity. The Bermuda High is usually anchored off the East Coast, spreading lots of heat and humidity into the eastern U.S. The jet stream is usually positioned well to the north and is weak.
From August 15 to August 24, high temperatures in Chicago are expected to range from 83 to 92 degrees. Low temperatures are expected to range from 67 to 73 degrees.
During the same time period, high temperatures in New York are expected to range from 85 to 93 degrees. Low temperatures are expected to range from 71 to 75 degrees.
Economic Events:
WEEKLY
James Hyerczyk is a U.S. based seasoned technical analyst and educator with over 40 years of experience in market analysis and trading, specializing in chart patterns and price movement. He is the author of two books on technical analysis and has a background in both futures and stock markets.