
Advertisement
Advertisement
Nearby Natural Gas Monthly Technical Analysis for November 2014
By:
Heavy selling pressure in October helped drive Nearby Natural Gas futures to its lowest level since the week-ending January 21. The catalysts behind the
Heavy selling pressure in October helped drive Nearby Natural Gas futures to its lowest level since the week-ending January 21. The catalysts behind the selling were mild temperatures in key demand areas and overproduction.
The selling pressure subsided, however, late in the month as forecasts for a hard freeze across the Midwest and East Coast helped trigger a month-ending short-covering rally. Now that the “shoulder period” has ended, traders will be focusing more on the weather forecasts. Natural gas bottomed the first week in November last year, leading to a tremendous rally into February when a “Polar Vortex” hit key demand areas.
Cold weather should be expected after all winter is coming. It’s the temperature level and the duration of the cold that will drive natural gas prices. If cold weather is predicted to linger then supply may not be able to keep up with demand. This would cause a sustainable rally.
If temperatures are normal and the country is hit with periodic bouts of cold weather then prices will likely stay the same or fall further as supply will be able to match demand. If you do the math, the supply appears ample at this time to be able to withstand a normal winter.
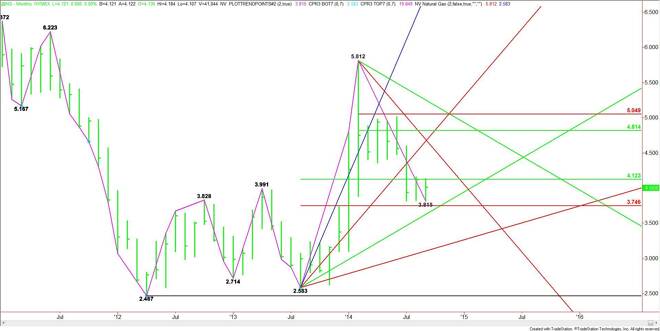
The main range is 2.659 to 5.888. The retracement zone of this range at 4.216 to 3.821 is currently being tested and the lower or Fibonacci level of the range is currently being straddled. For three months, natural gas consolidated inside this range before breaking through to the downside last month.
In addition to the Fib number at 3.821, the market is also currently testing a long-term uptrending angle at 3.8590. Look for a bullish tone to develop if the market can hold above both of these levels. If below average temperatures are predicted then look for a possible rally into the 50% level at 4.216. If the cold weather is expected to linger then look for a possible rally into 4.4480.
If temperatures and weather conditions are normal then sellers may try to take out 3.821 again. Because of seasonality factors, last month’s low at 3.6200 may hold another month because supply and demand may balance each other. A prediction of above-average temperatures and normal injections into inventory could combine to create further downside action.
Short-sellers are in control at this time, but this could shift as fast as the weather.
About the Author
James Hyerczykauthor
James Hyerczyk is a U.S. based seasoned technical analyst and educator with over 40 years of experience in market analysis and trading, specializing in chart patterns and price movement. He is the author of two books on technical analysis and has a background in both futures and stock markets.


Advertisement