Nikkei 225 consolidates after surging to a record high as Japanese stocks prepare for profit taking. However, the Nikkei 225 is likely to see further upside on the technical charts in the coming days as the correction will bring more buyers.
The oil market still affects the index. Japan is highly reliant on energy imports and falling oil prices tend to boost Japanese stocks. The decline in oil prices takes out some fears of inflation. However, the U.S. attacks on Iranian targets have introduced fresh rebounds in Brent and WTI oil from the support level. This indicates that the conflict is not fully over. This will help keep investors wary, since a further escalation could push up oil prices again and put pressure on corporate margins in Japan.
The overall trend remains bullish for the Nikkei 225 with the short term stretched momentum. It was a huge technical and psychological breakthrough above 65,000. Some investors are turning to secure profits while they await further clarity from the U.S.-Iran talks and oil prices. If oil drops further with unchanged regional risk appetite, the Nikkei 225 may continue its rally.
SoftBank and Chip-Related Stocks Drive Nikkei 225 Rally
SoftBank Leads the Rally
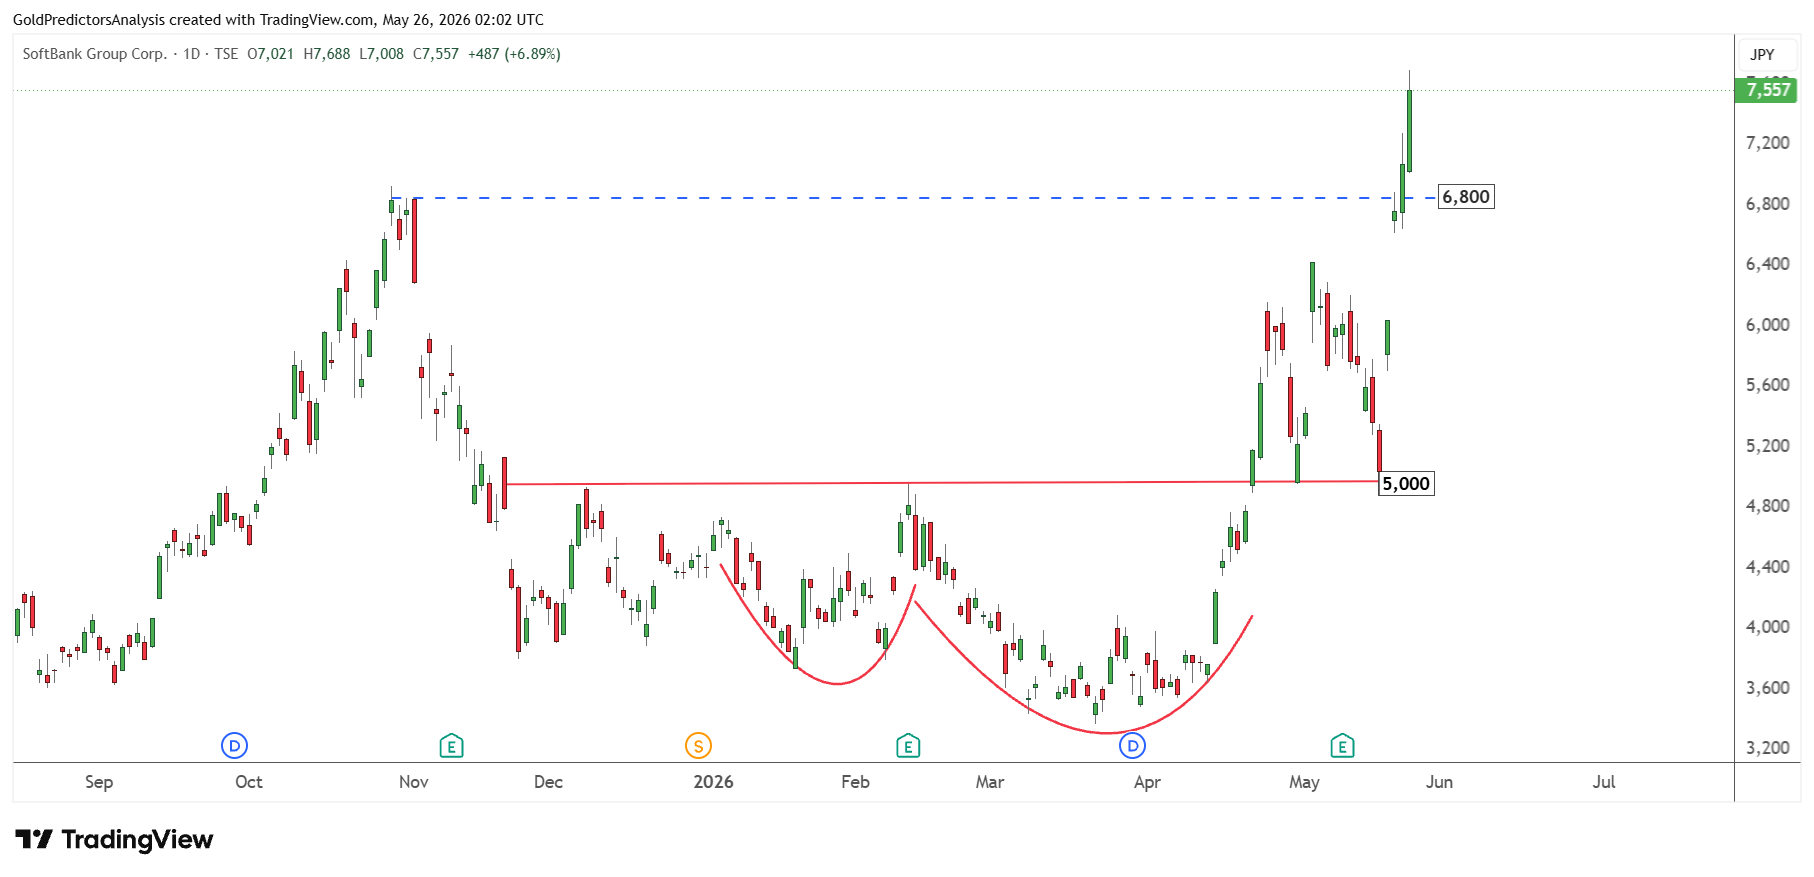
The surge in Nikkei 225 was driven by a broad Japanese stock rally, which is still unstoppable. The daily chart below for SoftBank shows that the stock has broken the 5,000 level and then also broken the record level of 6,800. This breakout has opened the door for a target of the 8,000 level as discussed previously. However, the stock is also now approaching the 8,000 level and still looks unstoppable in the short term.
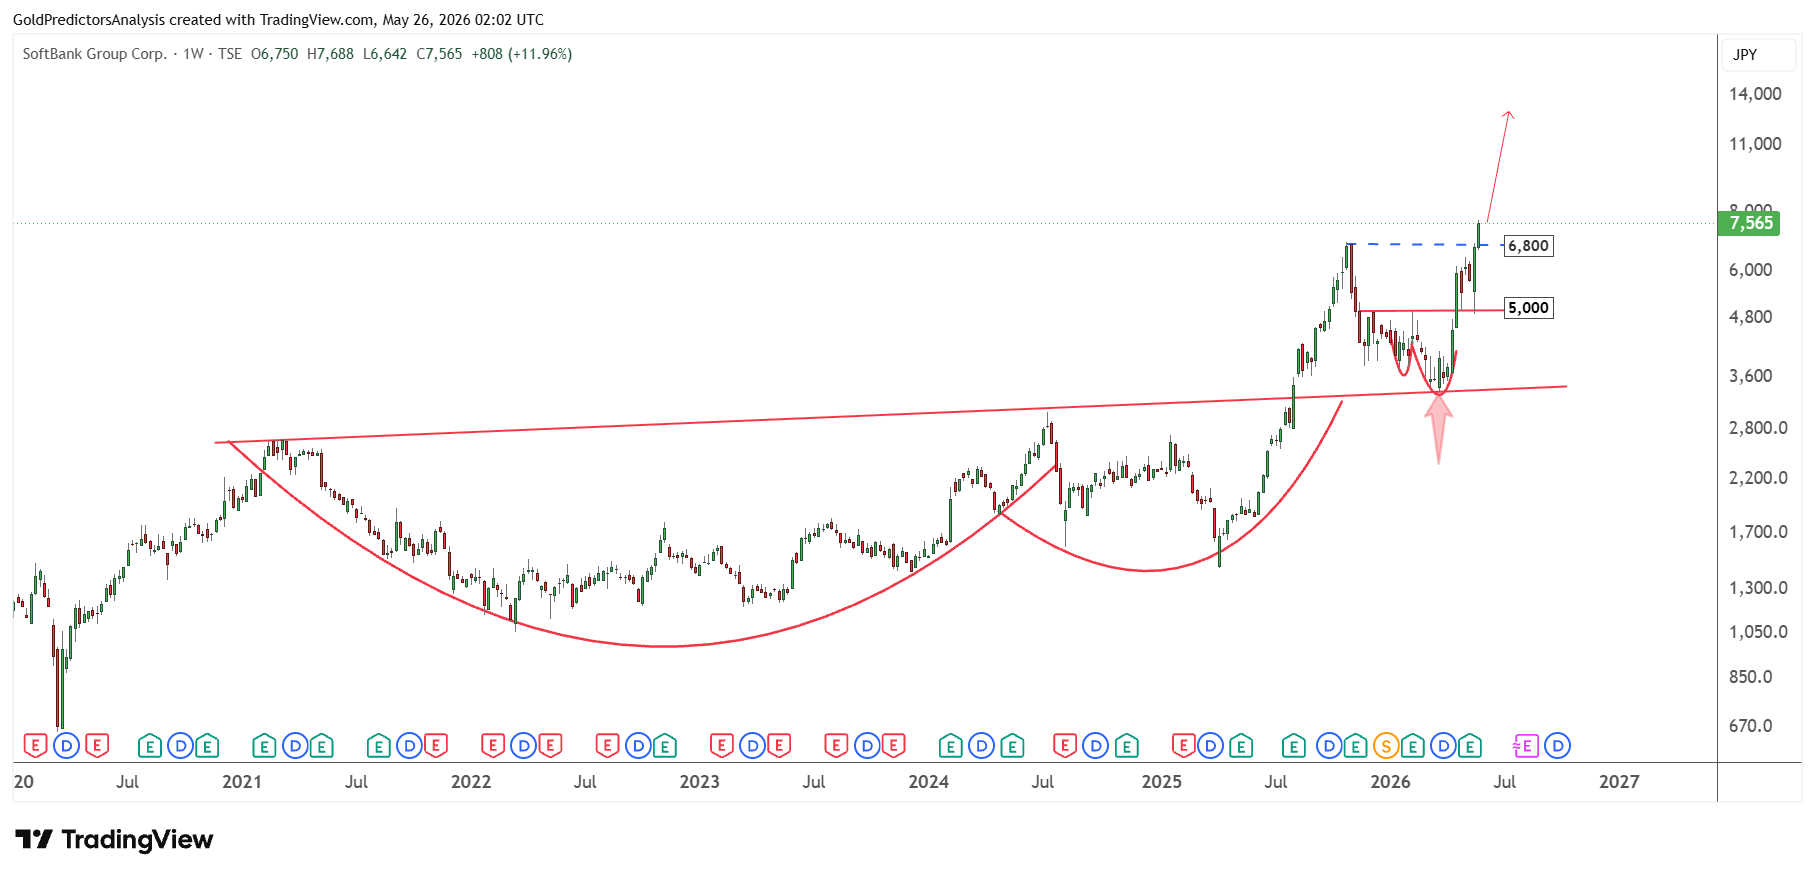
From a broader perspective, SoftBank has found a long-term bottom at 3,500 at the neckline of the cup and handle pattern. The cup and handle pattern formed from 2021 to 2025. These broader bullish patterns and the breakout above 6,800 indicate a sustained and strong move to the upside. This strong move will indicate a strong surge in Nikkei 225 in the next few weeks and months.
Nikkei Price Forecast
Every new Nikkei analysis as it publishes, today's technical signal and key levels, live price — on one page.
See all Nikkei forecastsSemiconductor Stocks Support Nikkei 225 Upside
The chart below shows that the IBEDEN Co. Ltd. has surged in a parabolic trend after forming a bottom 14,800 on 20 May 2026. Meanwhile, the Mitsui Kinzoku Co., Ltd. has also formed a bottom and is looking for a strong surge.
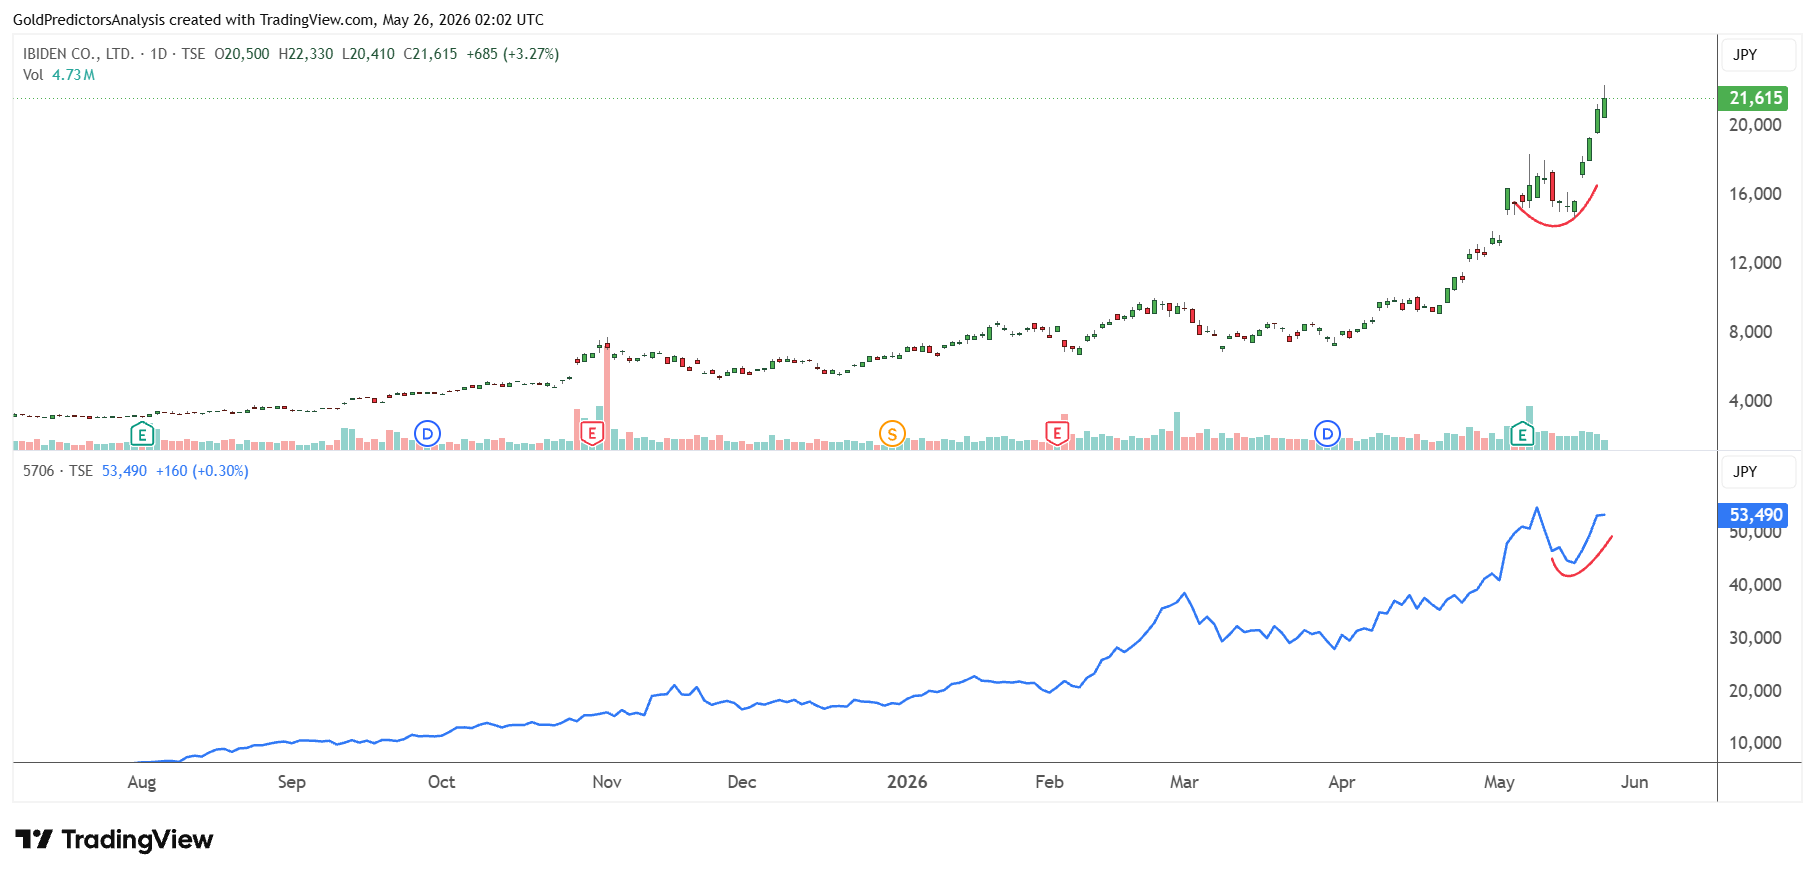
Despite this strong surge, the next price movement will likely be driven by semiconductor stocks, which are still consolidating after the record surge in April. The chart below shows that Tokyo Electron Limited consolidates around the 50,000 level and looks set to surge higher over the next few days.
Similarly, Advantest Corp. is also consolidating around the 25,000 to 30,000 level. This shows strong bullish momentum. On the other hand, Lasertec Corp. is consolidating below the neckline of the cup pattern at the 44,000 level. This consolidation indicates that a break above 45,000 will likely trigger a strong surge in Lasertec Corp.
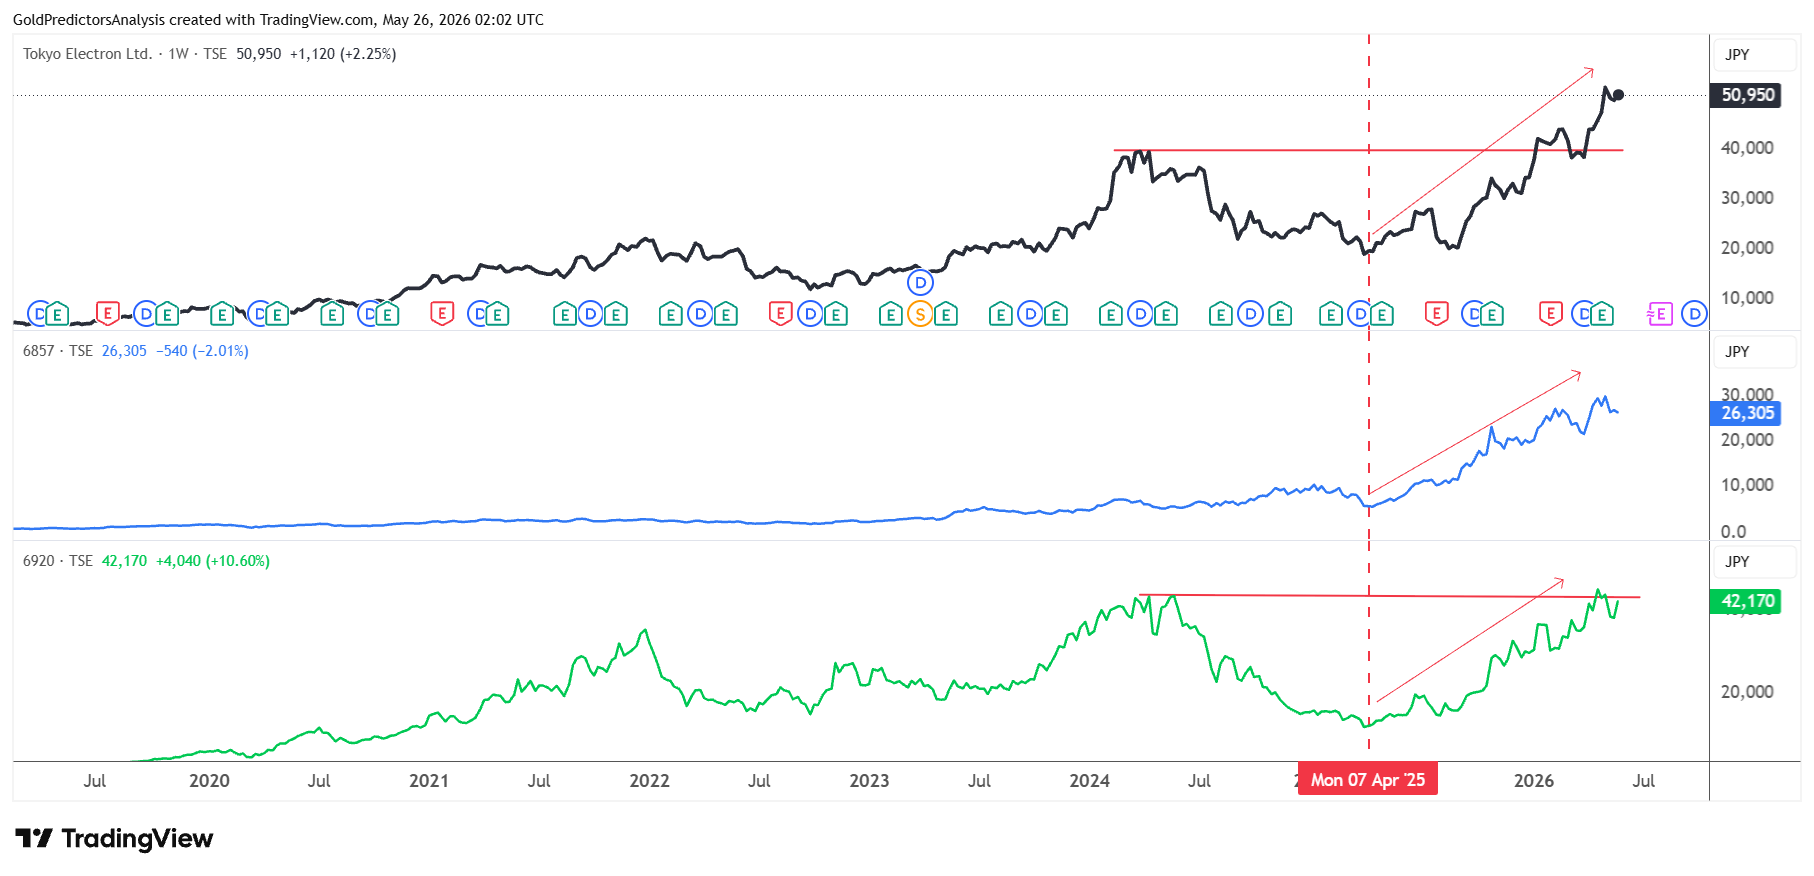
This strong momentum in broader Japanese stocks indicates that semiconductor and technology stocks remain key drivers of the Nikkei 225.
Nikkei 225 Breakout Signals More Upside
The monthly chart for Nikkei 225 also shows that the index has entered a parabolic trend after the breakout from the 45,000 level in September 2025.
This breakout developed from the ascending broadening wedge pattern. After the breakout of 45,000, the Nikkei 225 consolidated between 60,000 and 50,000 in March 2026 and then broke above 60,000.
In April 2026, Nikkei 225 gained around 12.60% in total, while in May 2026, it has so far gained 8.80%.
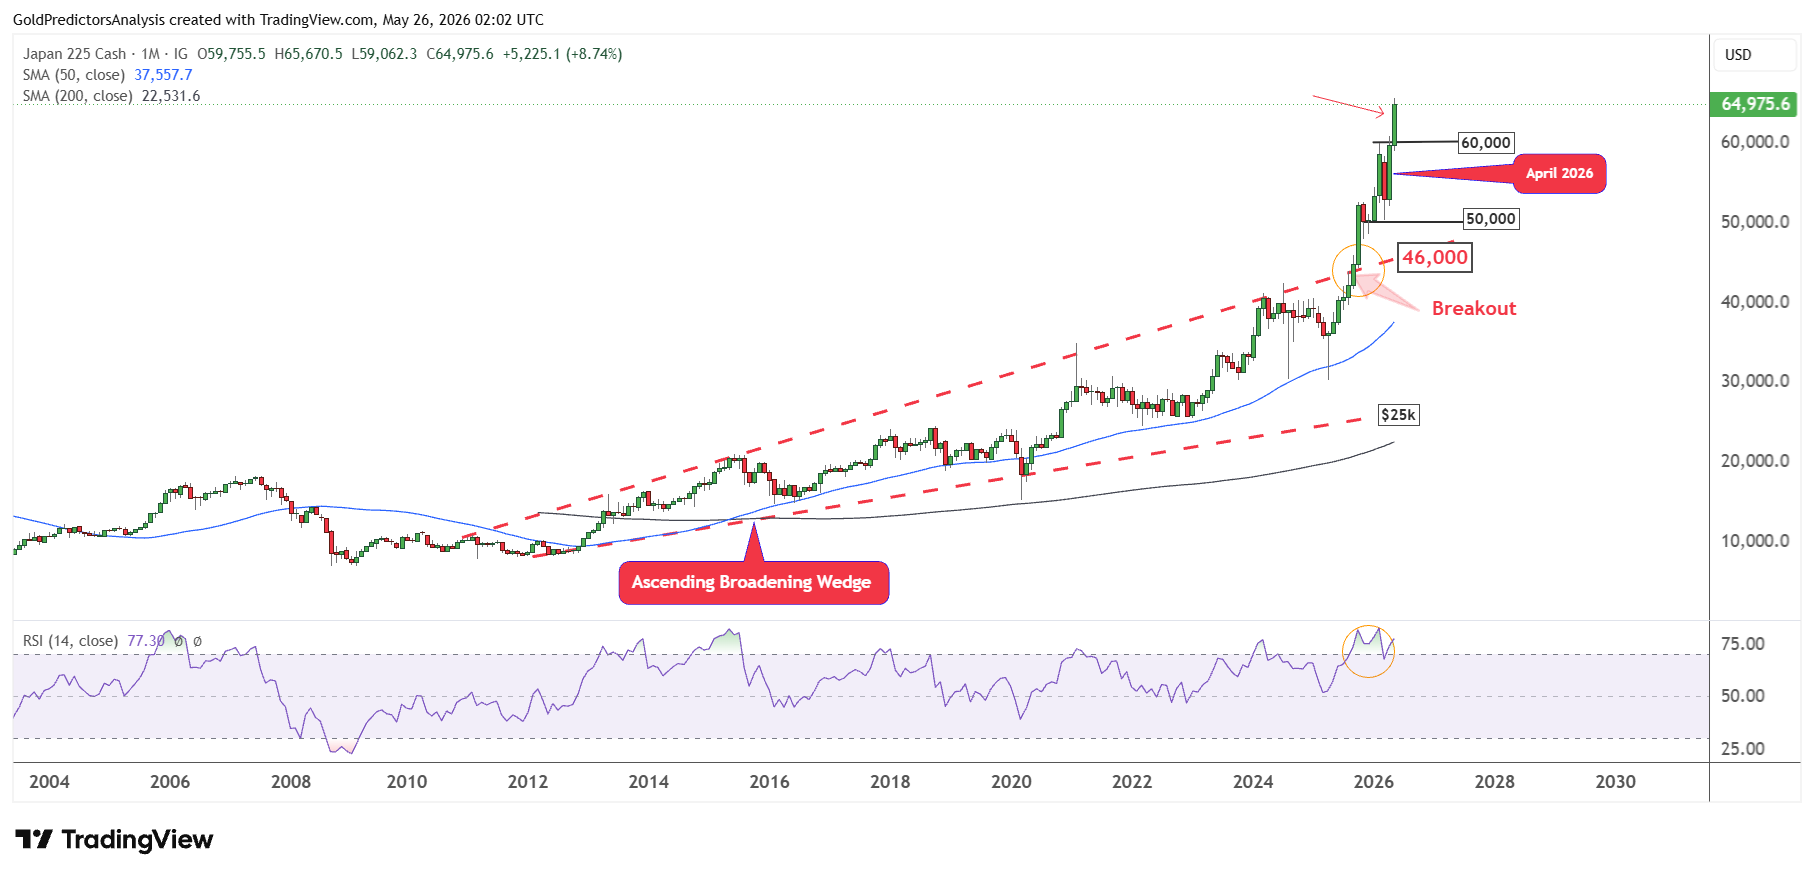
This strong surge on the monthly chart indicates a continued bullish trend. The index is still likely to continue higher after forming strong support at the nearest short-term support zone.
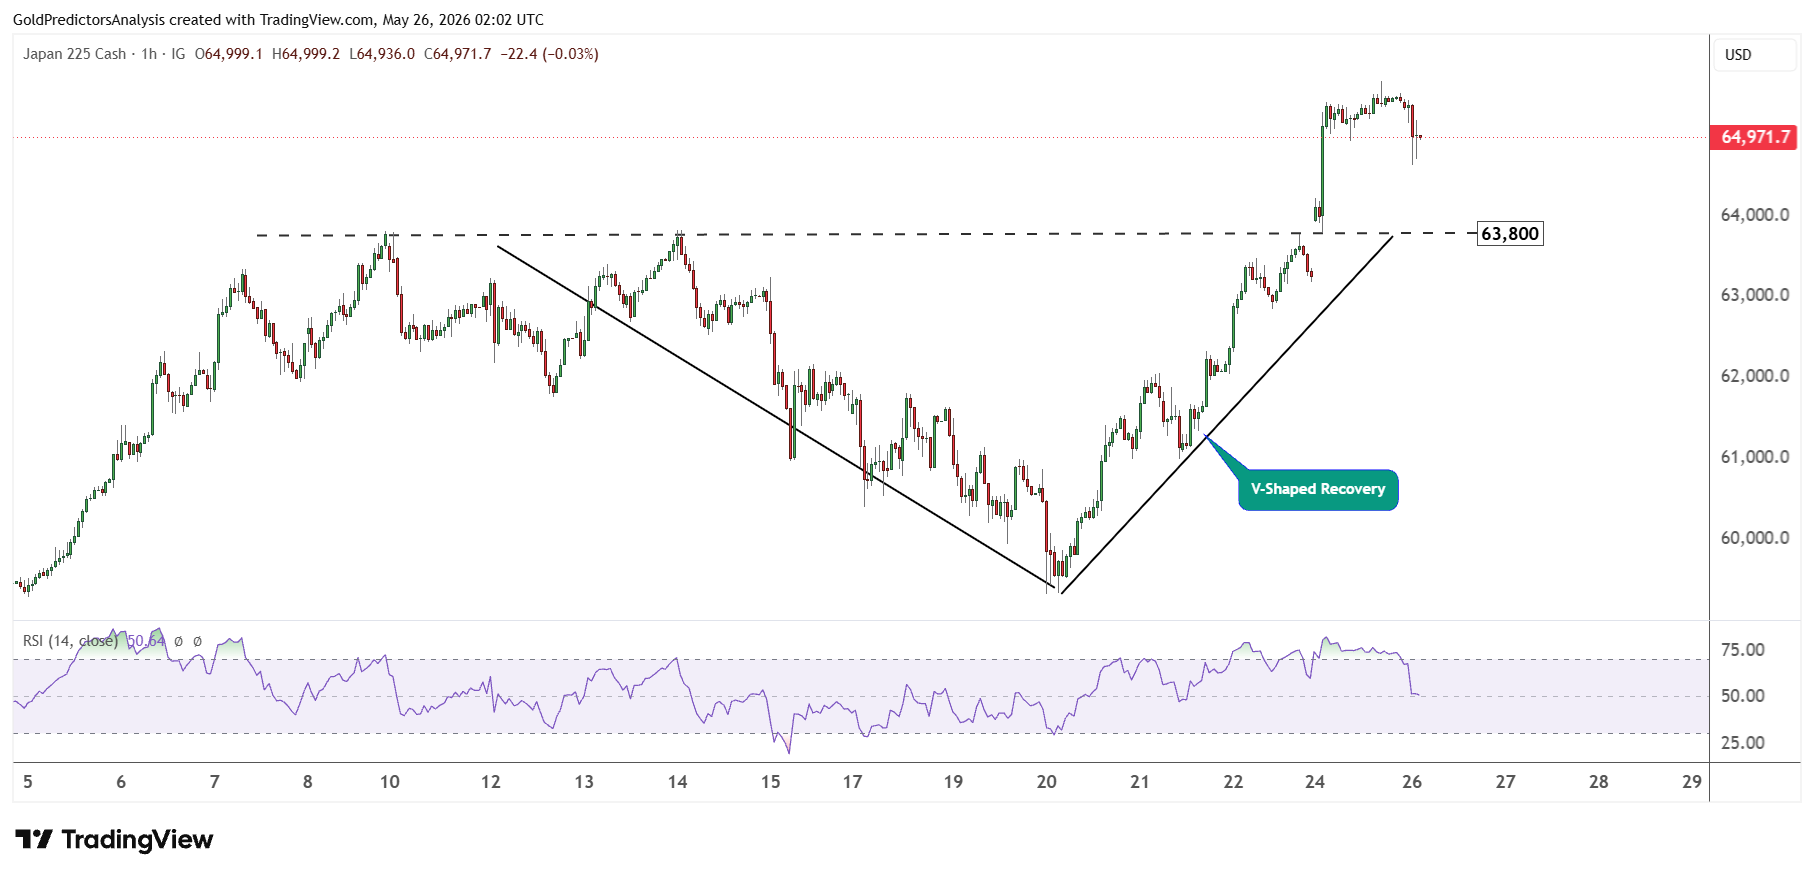
The index reached 65,670 and started to correct lower due to extremely overbought conditions in the short term. The nearest support remains at 63,800, which is the neckline of the V-shaped pattern.
The formation of the V-shaped pattern above the 60,000 level and then the breakout above 63,800 indicate strong bullish momentum in the short term for Nikkei 225. Therefore, any recovery back to the support zone will likely offer strong buying opportunity for new traders.
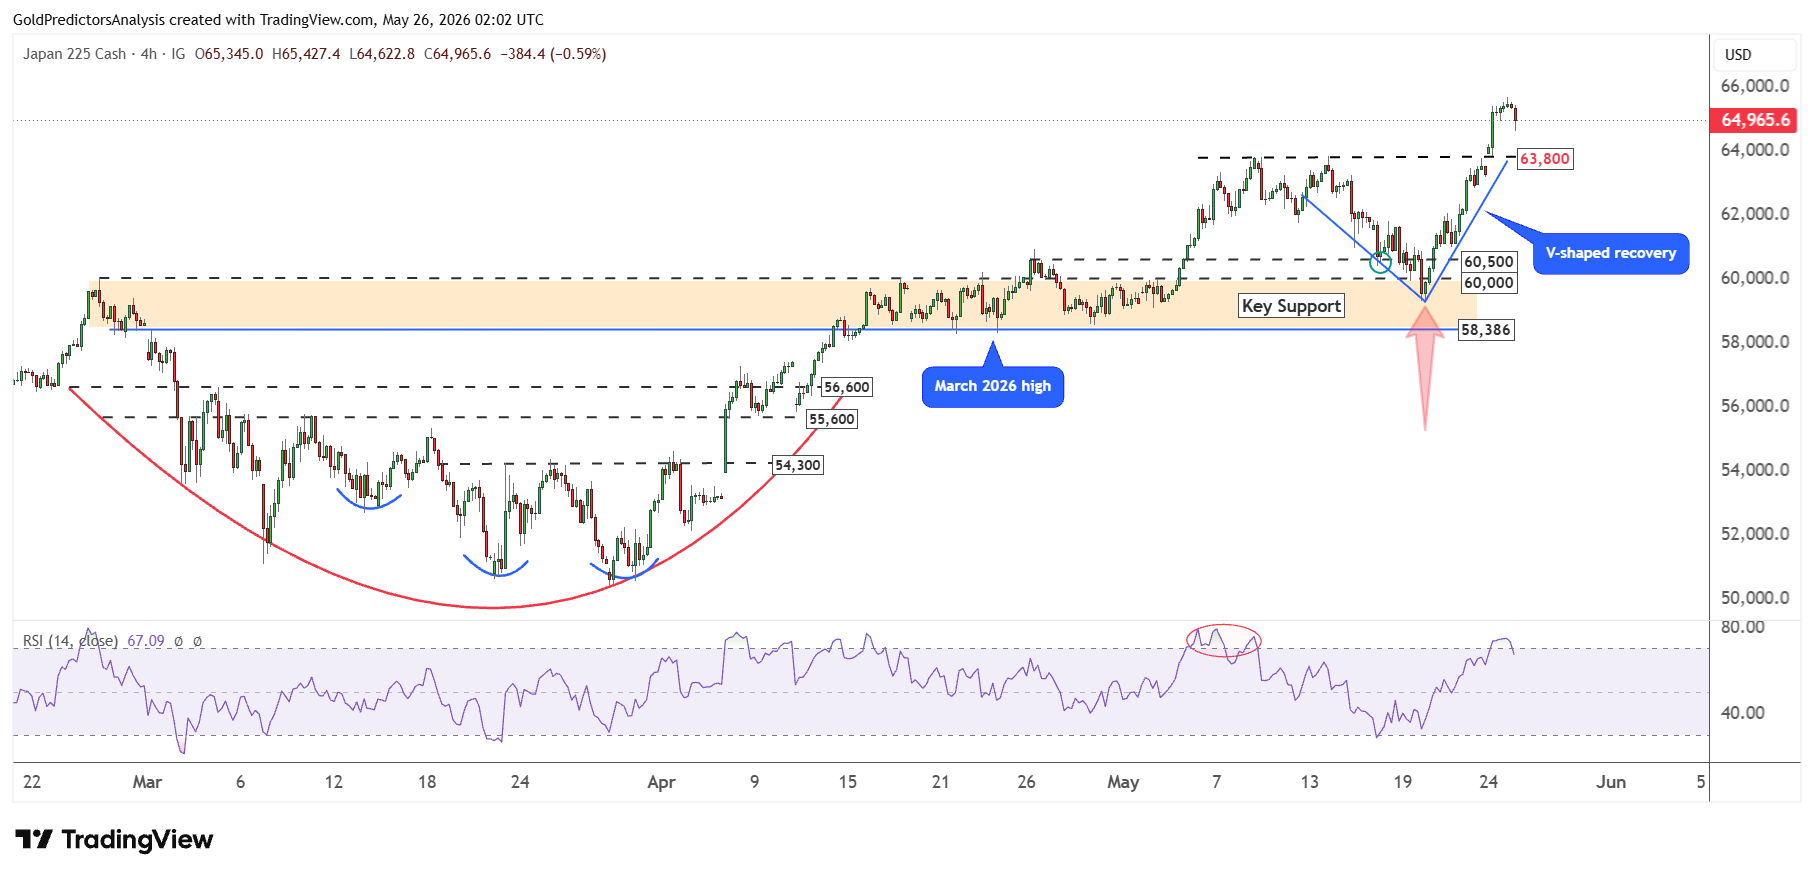
The hourly chart for Nikkei 225 also shows the V-shaped recovery. The hourly chart shows overbought conditions which is the reason for a slight correction on Tuesday. But this correction will likely offer the next buy signal for traders.
Bottom Line
Nikkei 225 remains in a bull market despite some short-term profit-taking from the record highs. A break above 65,000 indicates strong market momentum, but the market watches 63,800 as the next area of interest. As for the individual stocks, semiconductor, technology and AI stocks are helping the index. A pullback in the Nikkei 225 toward support could bring in more buyers. But the biggest risk is likely to be oil prices due to Japan’s heavy reliance on foreign energy supplies. If oil prices ease due to easing US-Iran tensions, the Nikkei 225 will continue its rally. However, any strength in oil prices will introduce a correction in the Nikkei 225 for the next buy signals. The Nikkei 225 still looks for a rally to 67,000 in the short term once the correction is over.