



Short-covering and increased demand for higher risk assets helped boost the NZD/USD last week. A strong gain by its counterpart, the Australian Dollar also contributed to the move. However, the rally is not expected to last because of the bearish divergence between the monetary policies of the hawkish U.S. Federal Reserve and the dovish Reserve Bank of New Zealand.
Weekly Swing Chart Technical Analysis
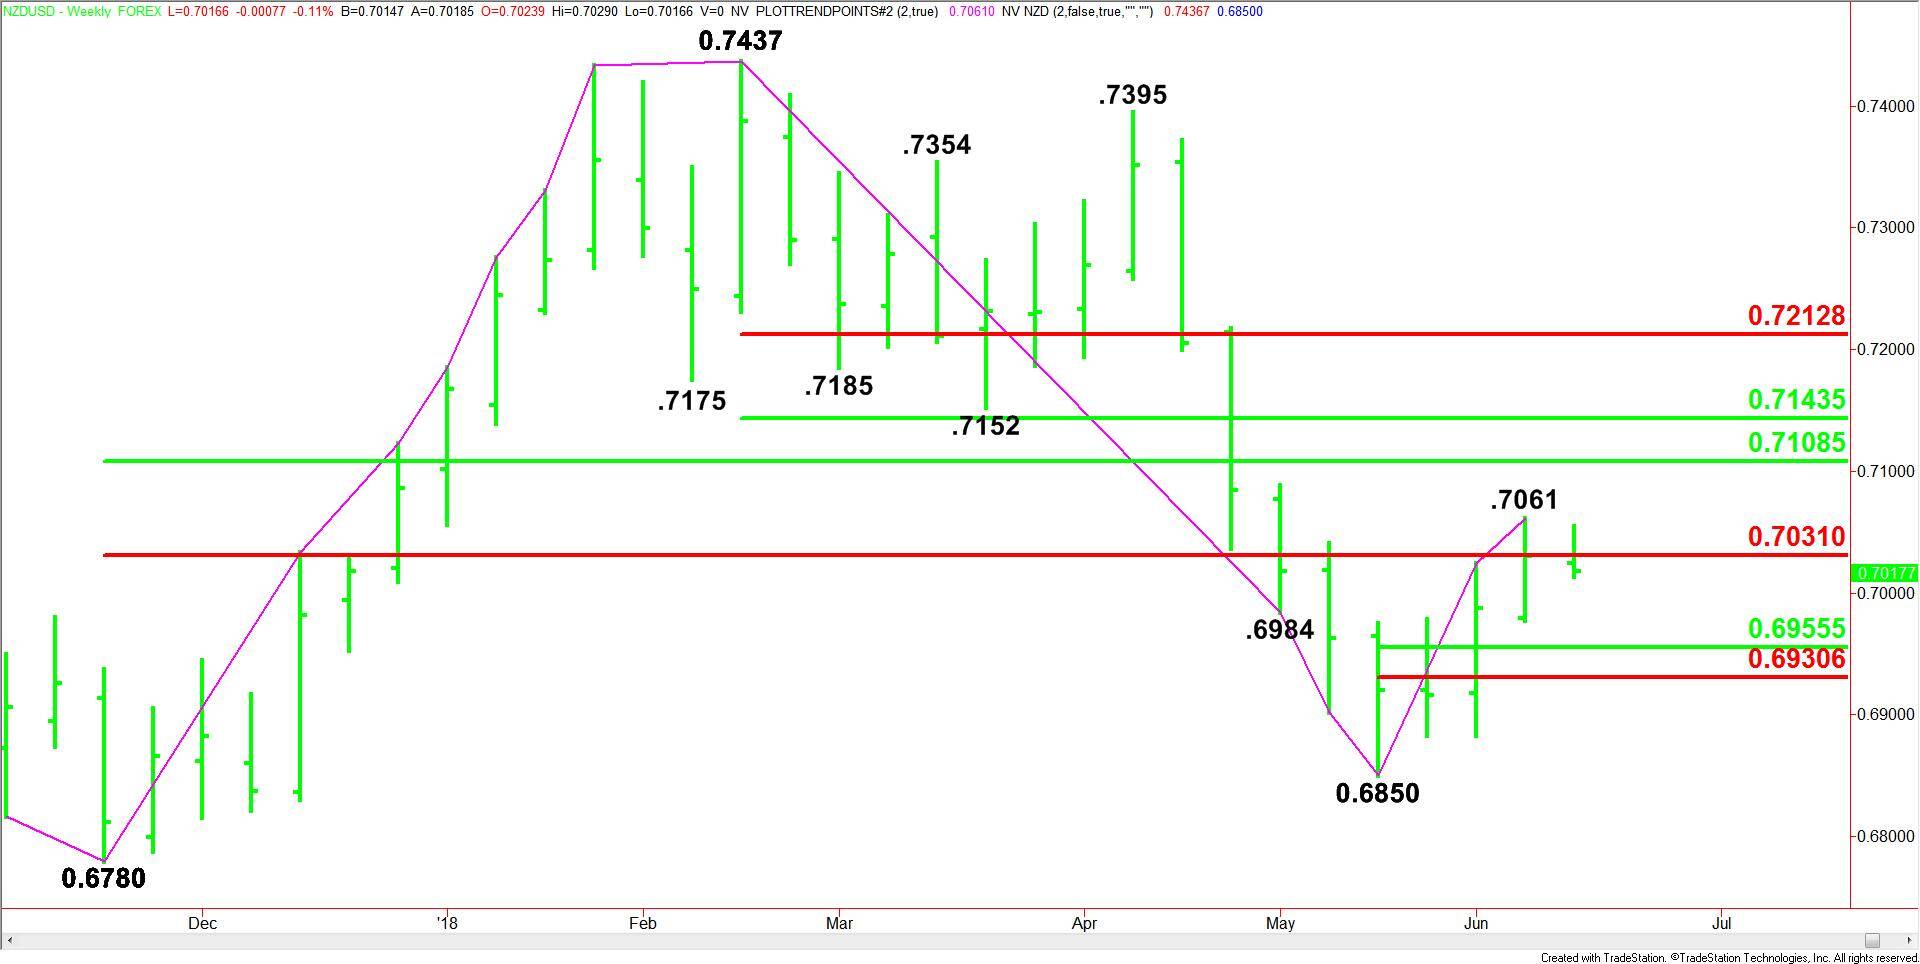
The main trend is down according to the daily swing chart. A trade through .6850 will signal a resumption of the downtrend.
The main range is .6780 to .7437. Its retracement zone at .7109 to .7031 is acting like resistance. It is controlling the longer-term direction of the NZD/USD. The Forex pair is currently trading inside this range.
The intermediate range is .7437 to .6850. Its retracement zone at .7144 to .7213 is the primary upside target.
The short-term range is .6850 to .7061. Its retracement zone at .6955 to 6931 is the primary downside target.
Weekly Swing Chart Technical Forecast
Based on Friday’s close at .7030, the direction of the NZD/USD this week is likely to be determined by trader reaction to the main Fibonacci level at .7031.
A sustained move over .7031 will indicate the presence of buyers. This could lead to a test of last week’s high at .7061. Taking out this level could trigger a surge into .7109, followed by .7144.
A sustained move under .7031 will signal the presence of sellers. This could trigger a break into the short-term retracement zone at .6955 to .6931.
Aggressive counter-trend buyers may step in on the first test of the short-term retracement zone.