The New Zealand dollar fell initially during the day on Tuesday but found enough support near the 50% Fibonacci retracement level to turn things around
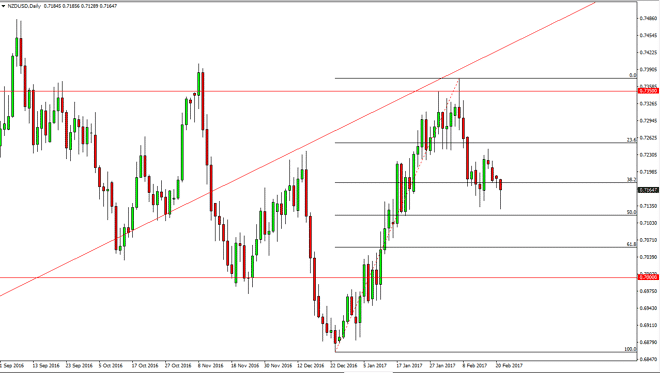
The New Zealand dollar fell initially during the day on Tuesday but found enough support near the 50% Fibonacci retracement level to turn things around and form a hammer. That of course is a bullish sign, and a break above the top of the candle during the day should send this market looking for the 0.7250 level above. I think we will eventually reach towards the 0.7350 level also, but pay attention to the commodity markets as the New Zealand dollar seems to be a general barometer of how things are going over there. The higher they go, the higher this pair goes.
Chris is a proprietary trader with more than 20 years of experience across various markets, including currencies, indices and commodities. As a senior analyst at FXEmpire since the website’s early days, he offers readers advanced market perspectives to navigate today’s financial landscape with confidence.