The New Zealand dollar fell slightly during the day on Friday as we continue to see support at the 50% Fibonacci retracement level. The 0.6850 level
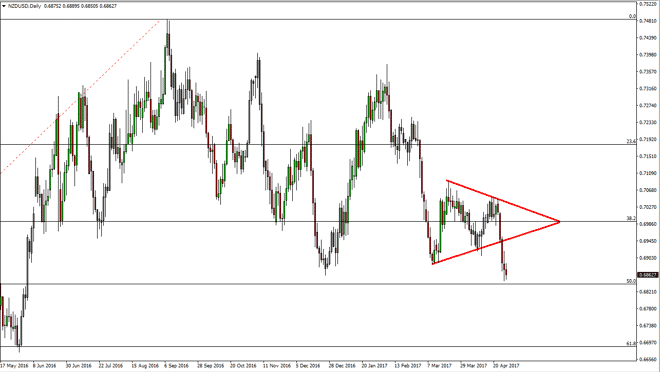
The New Zealand dollar fell slightly during the day on Friday as we continue to see support at the 50% Fibonacci retracement level. The 0.6850 level continues to be supportive, as it was resistive in the past. If we can break down below there I think that the market will drop down. A bounce from here should send the market towards the bottom of the symmetrical triangle that we broke down below, where I would expect to see resistance. This will be a very interesting market, but currently it looks as if it is negative.
Chris is a proprietary trader with more than 20 years of experience across various markets, including currencies, indices and commodities. As a senior analyst at FXEmpire since the website’s early days, he offers readers advanced market perspectives to navigate today’s financial landscape with confidence.