



Monday’s 7% Drop Was a Headline, Not a Deal
Spot Brent crude oil dropped more than $7 on Monday and fell to the mid-$90s. July WTI crude oil lost over $6 and slid toward $90. That is a 6% to 7% move in a single session and none of it had anything to do with inventories, demand or OPEC.
Weekend headlines out of Doha suggested that U.S.-Iran talks had made real progress toward a framework that could include reopening the Strait of Hormuz. Traders who had been sitting on a heavy geopolitical premium hit the sell button before anyone confirmed whether the headlines were real.
Hope Got Priced. A Deal Did Not.
The Doha talks involved Iranian and Qatari officials discussing a memorandum of understanding tied to ending the conflict and establishing a 60-day window for final negotiations.
President Trump said talks were moving in a positive direction but also said there was no rush and the United States would not accept a weak deal. That second part got buried under the selling but it matters more than the first part. Tehran has not confirmed anything close to a final agreement. Iranian officials have said the current discussions are focused on ending the war and reopening shipping lanes.
The harder issues, sanctions relief, frozen funds, nuclear terms and long-term security guarantees, are still sitting on the table untouched. Monday’s price action traded a possible breakthrough. Not a signed one.
Full Reopening Breaks the Floor
JPMorgan has crude falling toward $70 to $80 if the Strait of Hormuz reopens quickly and that number is not fantasy. Right now some LNG vessels and at least one crude tanker have moved through but that is not normal commercial flow.
Brent Oil Price Forecast
Every new Brent Oil analysis as it publishes, today's technical signal and key levels, live price — on one page.
See all Brent Oil forecastsSteady vessel traffic, lower insurance costs, fewer military escorts and unrestricted Gulf exports all have to show up before traders start pulling the risk premium out permanently. If all of those pieces land at once, Spot Brent crude oil takes the hardest hit because it carries the most direct Hormuz exposure. July WTI crude oil follows lower but Brent is where the premium lives and where the premium gets removed.
Restricted Lanes Keep the Bid
Goldman Sachs has made the point that crude trades well above fair value when traders believe supply losses will last. Citi has warned that a prolonged Hormuz disruption keeps volatility elevated and supports much higher Spot Brent crude oil pricing. Both of those views describe what is actually happening right now.
Tankers moving through delays, inspections, restricted lanes and war-risk insurance premiums that have not dropped is not a reopening. It is available supply that nobody trusts. That keeps a floor under July WTI crude oil and Spot Brent crude oil because the risk has not been removed. It has just been rearranged.
Peace and Strikes Hit the Same Session
U.S. military action against Iranian targets landed after Monday’s selloff. Traders sold on hopes of a deal and within hours watched strike reports and mine-related risks raise immediate questions about whether any framework can hold. That is the problem with this market right now. It is carrying a deal premium and a fear premium at the same time and both can unwind in the same session.
Peace headlines crush prices. Military headlines lift them. Until one side of that trade gets resolved permanently, wide ranges and fast reversals are the cost of being in this market.
Weekly July WTI Crude Oil Futures Technical Analysis
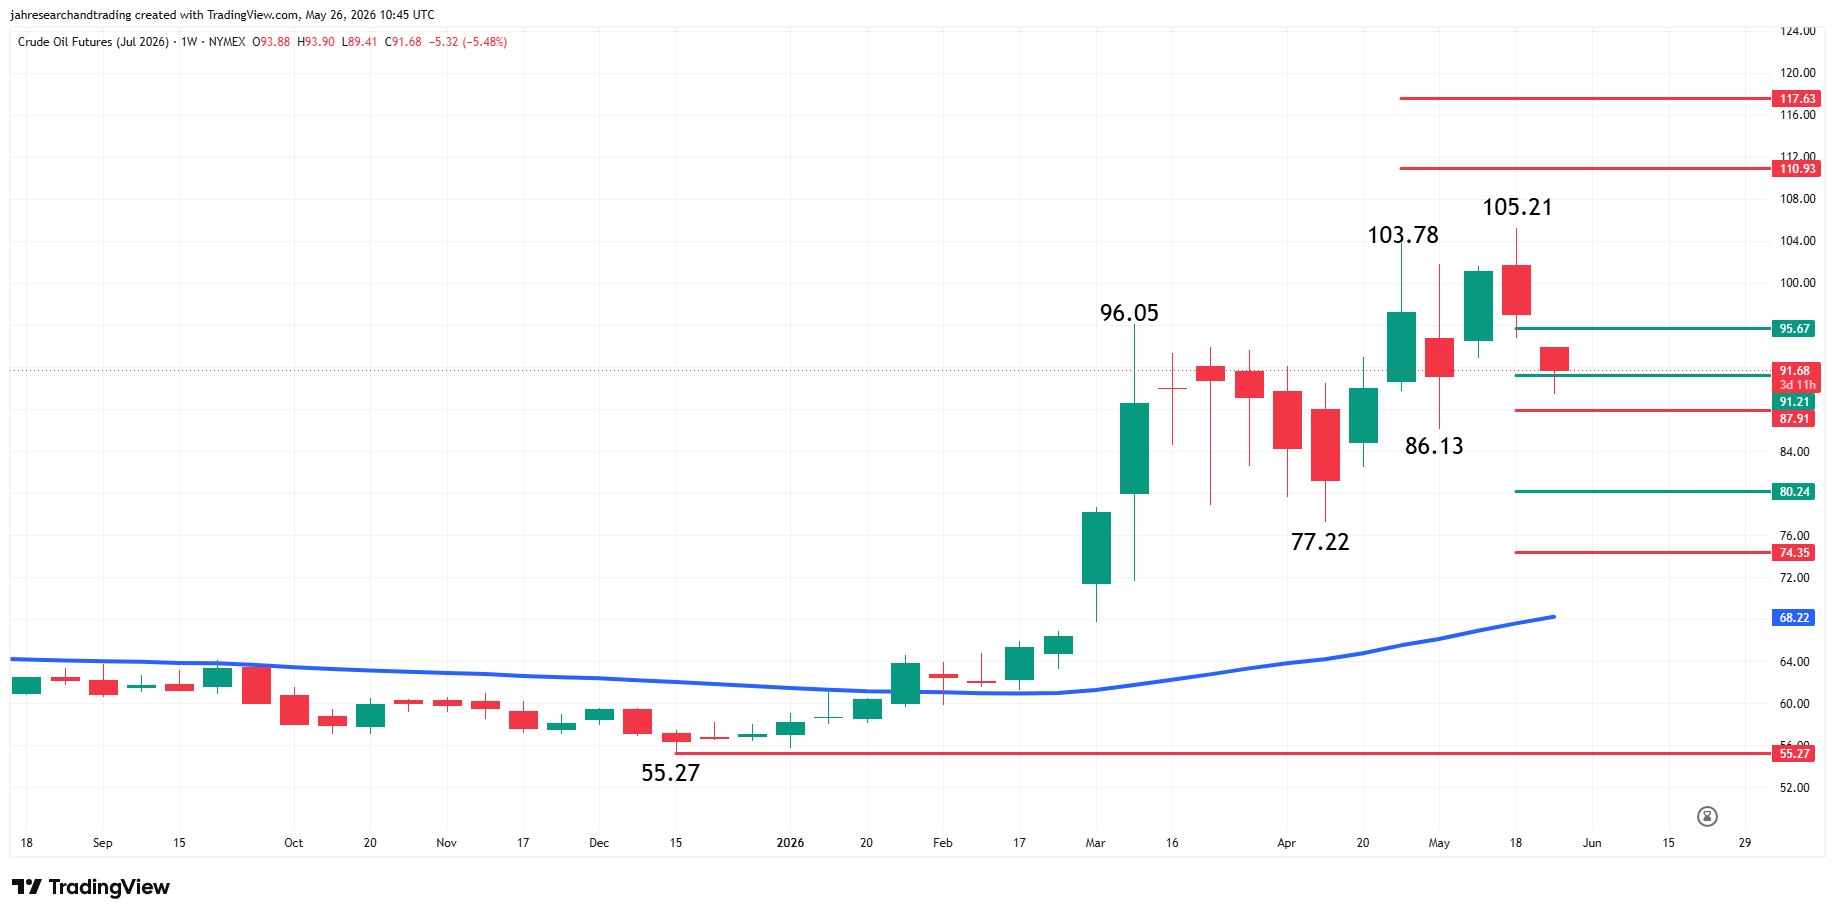
Despite Monday’s gap lower opening, the main trend remains up on the weekly chart. A trade through $105.21 will signal a resumption of the uptrend. The main trend will change to down on a trade through $77.22.
The minor trend is also up. A trade through $86.13 will change the minor trend to down. This will shift momentum to the downside.
The 52-week moving average at $68.23 is controlling the long-term uptrend.
The long-term range is $55.27 to $105.21. Its retracement zone at $80.24 to $74.35 is the last potential support zone before the 52-week MA.
The intermediate range is $77.22 to $105.21. Its retracement zone at $91.21 to $87.91 is currently being tested. It held on Monday when the market fell to $89.41.
The short-term range is $86.13 to $105.21. Its 50% level is the first resistance at $95.67. Additional resistance is $110.93.
With the main trend up according to the swing chart and the 52-week moving average, traders are still in buy the dip mode. This strategy will weaken if $86.13 fails. If the main trend changes to down, then traders will shift to sell the rally mode.
Weekly July Brent Crude Oil Futures Technical Analysis
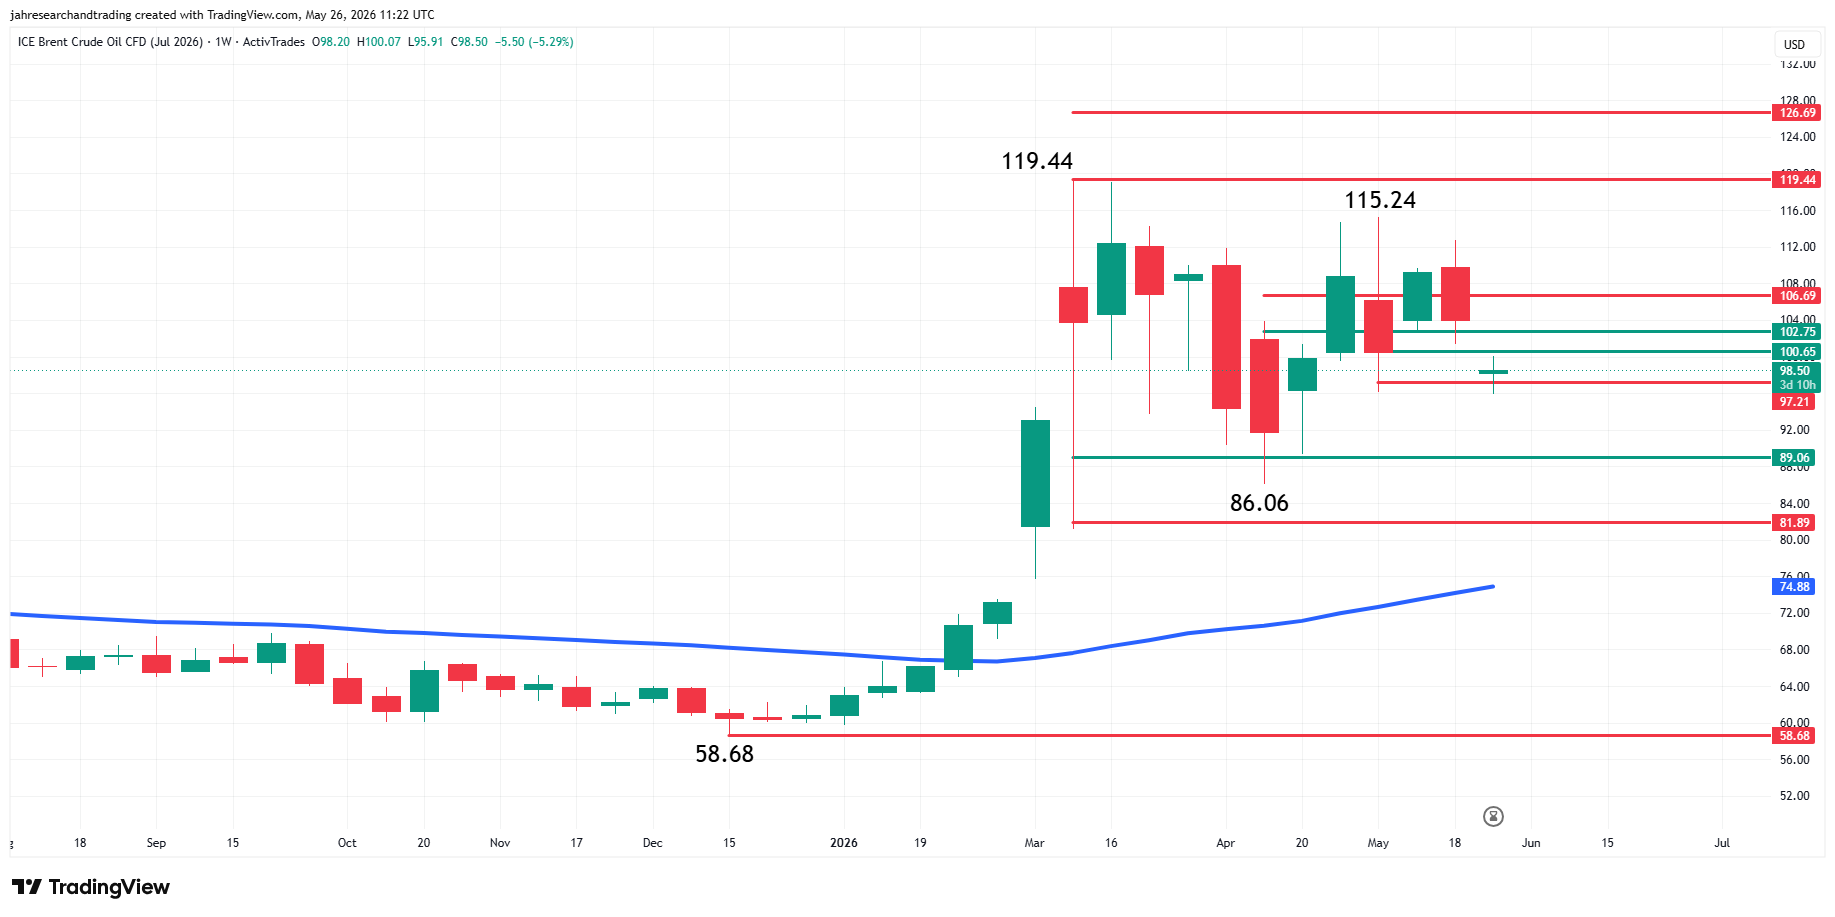
July Brent crude oil futures are still in an uptrend despite Monday’s gap lower opening. However, momentum has shifted to the downside. Nonetheless, the uptrend remains intact.
A trade through $115.24 will reaffirm the main trend. A trade through $86.06 will change the main trend to down.
The market is currently tied up inside a retracement zone at $97.21 to $100.65. This is slightly below another retracement zone at $102.75 to $106.69. These levels could provide headwinds unless there is a bullish catalyst driving the price action.
If sellers continue to pound the downside, the market could collapse into the long-term retracement zone at $89.06 to $81.89. This is the last support before the 52-week moving average at $74.89.
Unlike the WTI market, the uptrend in Brent is not that strong so any rally is going to be a labored event until buyers can cross to the strong side of $106.69.
Weekly Outlook
Tehran has not confirmed a deal. The hard terms are untouched. U.S. military strikes hit Iranian targets hours after Monday’s selloff. Three facts and all three say the same thing.
The risk premium everyone tried to sell on Monday is not gone. It got repriced lower on a headline and then the headline fell apart. Until tankers are moving freely through the Strait of Hormuz with falling insurance costs and no military escorts, every selloff is a buying opportunity for traders who understand that hope is not the same thing as a signed agreement.
July WTI crude oil flushed to $89.41 on Monday and held the intermediate retracement zone at $91.21 to $87.91. That zone decides the week. Above it and buyers stay in control with $95.67 as the first target. A break under $86.13 flips the structure entirely and hands momentum to sellers looking for $80.24 to $74.35.
If you’d like to know more about how to trade crude oil, please visit our educational area.