After a mixed Monday, DOGE and SHIB saw red this morning. The SEC and the US economic calendar will likely test investor sentiment this afternoon.
Dogecoin (DOGE) ended the session flat on Monday. Following a 0.12% loss on Sunday, DOGE ended the day at $0.0821.
After a choppy start to the day, DOGE rallied to an early morning high of $0.0865. DOGE broke through the First Major Resistance Level (R1) at $0.0848 before sliding to a late afternoon low of $0.0793. DOGE briefly fell through the First Major Support Level (S1) at $0.0803 before ending the day at $0.0821.
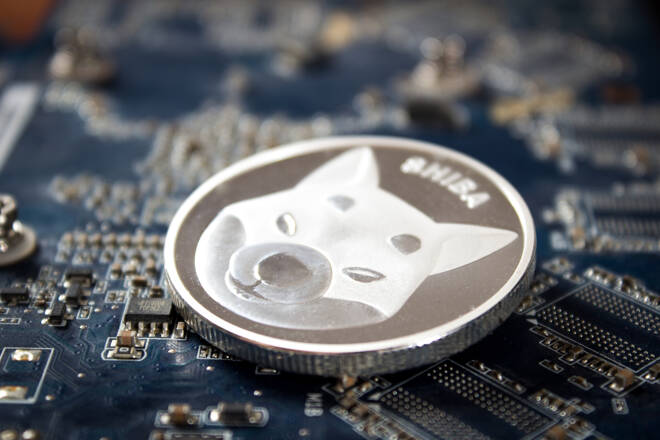
Shiba inu coin (SHIB) fell by 2.81% on Monday. Following a 0.62% loss on Sunday, SHIB ended the day at $0.00001247.
A bullish start to the day saw SHIB rise to an early morning high of $0.00001307. Falling short of the First Major Resistance Level (R1) at $0.00001339, SHIB slid to a late afternoon low of $0.00001199. SHIB briefly fell through the First Major Support Level (S1) at $0.00001242 to test the Second Major Support Level (S2) at $0.00001201 before ending the day at $0.00001247.
It was another quiet session on Monday, with the Shibarium Network yet to provide further details of the Shibarium Upgrade, including the upgrade date. The Dogecoin Foundation was also radio silent, with no updates since launching the Development Fund.
The lack of network updates left DOGE and SHIB on the back foot, with the SEC weighing on investor sentiment.
News of the SEC planning to sue Paxos of the Binance USD (BUSD) sent the crypto market into the red. Regulation by enforcement has gathered pace in the wake of the FTX bankruptcy. With the SEC looking beyond staking to stablecoins, regulatory uncertainty will remain a headwind until a clear regulatory framework is in place.
However, DOGE avoided the red, with Elon Musk delivering much-needed support. Elon Musk responded to a tweet asking what Elon Musk and Rupert Murdoch were talking about at the Super Bowl. Elon Musk tweeted Dogecoin in response, which sent DOGE into a Super Bowl rally. If that wasn’t enough support, Musk donned a Dogecoin T at the event.
US economic indicators, Fed chatter, and the SEC will be in focus today. The US CPI Report could send the pair into the red. A hotter-than-expected heading inflation number could force the Fed into a more aggressive interest rate trajectory to bring inflation to target.
With inflation in the spotlight, Fed chatter will also influence, with FOMC members Logan, Harker, and Williams speaking after the release.
However, investors should monitor the crypto news wires for SEC activity and FTX, Genesis, and Silvergate Bank updates. The increased level of regulatory uncertainty will likely lead to a choppier afternoon session.
This morning, DOGE was down 0.97% to $0.0813. A mixed start to the day saw DOGE rise to an early high of $0.0824 before falling to a low of $0.0812.
DOGE needs to move through the $0.0826 pivot to target the First Major Resistance Level (R1) at $0.0860 and the Monday high of $0.0865. A return to $0.0830 would signal a bullish DOGE session. However, the broader crypto market and network updates need to be DOGE-friendly to support a breakout session.
In the event of an extended rally, the Second Major Resistance Level (R2) at $0.0898 would likely come into play. The Third Major Resistance Level (R3) sits at $0.0970.
Failure to move through the pivot would leave the First Major Support Level (S1) at $0.0788 in play. However, barring another SEC-fueled extended sell-off, DOGE should avoid sub-$0.0780 and the Second Major Support Level (S2) at $0.0754. The Third Major Support Level (S3) sits at $0.0682.
The EMAs sent a bearish signal, with DOGE sitting below the 50-day EMA, currently at $0.0849. Following the Sunday bearish cross, the 50-day EMA pulled further back from the 100-day EMA, with the 100-day EMA narrowing to the 200-day EMA. The price signals were bearish.
A move through the 50-day ($0.0849) and 200-day ($0.0859) EMAs would support a breakout from R1 ($0.0860) to target the 100-day EMA ($0.0864) and R2 ($0.0898). However, a bearish cross of the 100-day EMA through the 200-day EMA would bring S1 ($0.0788) into view. A move through the 50-day EMA would send a bullish signal.
At the time of writing, SHIB was down 0.80% to $0.00001237. A mixed start to the day saw SHIB rise to an early high of $0.00001252 before falling to a low of $0.00001227.
SHIB needs to move through the $0.00001251 pivot to target the First Major Resistance Level (R1) at $0.00001303 and the Monday high of $0.00001307. A return to $0.00001300 would signal an extended bullish session. However, SHIB would need more details on the Shibarium upgrade and broader market support to deliver a breakout session.
In the event of an extended rally, SHIB could test the Second Major Resistance Level (R2) at $0.00001359. The Third Major Resistance Level (R3) sits at $0.00001467.
Failure to move through the pivot would leave the First Major Support Level (S1) at $0.00001195 in play. However, barring another extended sell-off, SHIB should avoid sub-$0.00001150 and the Second Third Major Support Level (S2) at $0.00001143.
The Third Major Support Level (S3) sits at $0.00001035.
The EMAs sent a bearish signal, with SHIB sitting below the 100-day EMA, currently at $0.00001275. The 50-day EMA closed in on the 100-day EMA, with the 100-day EMA narrowing to the 200-day EMA. The signals were bearish.
A move through the 100-day ($0.00001275) and 50-day ($0.00001290) EMAs would give the bulls a run at R1 ($0.00001303). A breakout from the 50-day EMA would send a bullish signal. However, a fall through the 200-day EMA ($0.00001202) would bring S1 ($0.00001195) into view.
With over 28 years of experience in the financial industry, Bob has worked with various global rating agencies and multinational banks. Currently he is covering currencies, commodities, alternative asset classes and global equities, focusing mostly on European and Asian markets.