
In contrast to this, the ongoing tension in the Middle East and Europe were seen as a key factors that help Silver price to limit its deeper losses.
Fed’s Outlook of Fewer Rate Cuts and its Impact on Silver Price
On the US front, the Federal Reserve’s revised outlook, projecting only one rate cut in 2024 compared to earlier expectations of three cuts, has had a strong impact on silver prices.
Silver, like gold, is sensitive to changes in interest rate expectations because higher rates typically strengthen the US dollar, making dollar-denominated commodities more expensive for holders of other currencies.
On the data front, the U.S. Bureau of Labor Statistics (BLS) reported that inflation, measured by the Consumer Price Index (CPI), remained unchanged in May for the first time since last June, with the yearly rate slightly decreasing to 3.3% from 3.4%.
The annual core CPI, which excludes food and energy prices, increased by 0.2% in May and rose 3.4% on a yearly basis, compared to the 3.6% increase in April and the expected 3.5%.
Therefore, the Federal Reserve’s hawkish stance and a stronger US dollar put pressure on the Silver price. Meanwhile, the the Federal Reserve’s unexpected hawkish stance overshadowed softer consumer inflation figures.
Geopolitical Tensions in the Middle East and Europe’s Political Uncertainty
On the Geopolitical front, the ongoing tension in the Middle East and Europe have provided some support to the safe-haven Silver price. The renewed political uncertainty in Europe such as French President Emmanuel Macron’s decision to call snap elections have increased uncertainty into global markets. Thus, the geopolitical unrest tends to bolster demand for safe-haven assets, including both gold and silver.
Short-Term Forecast
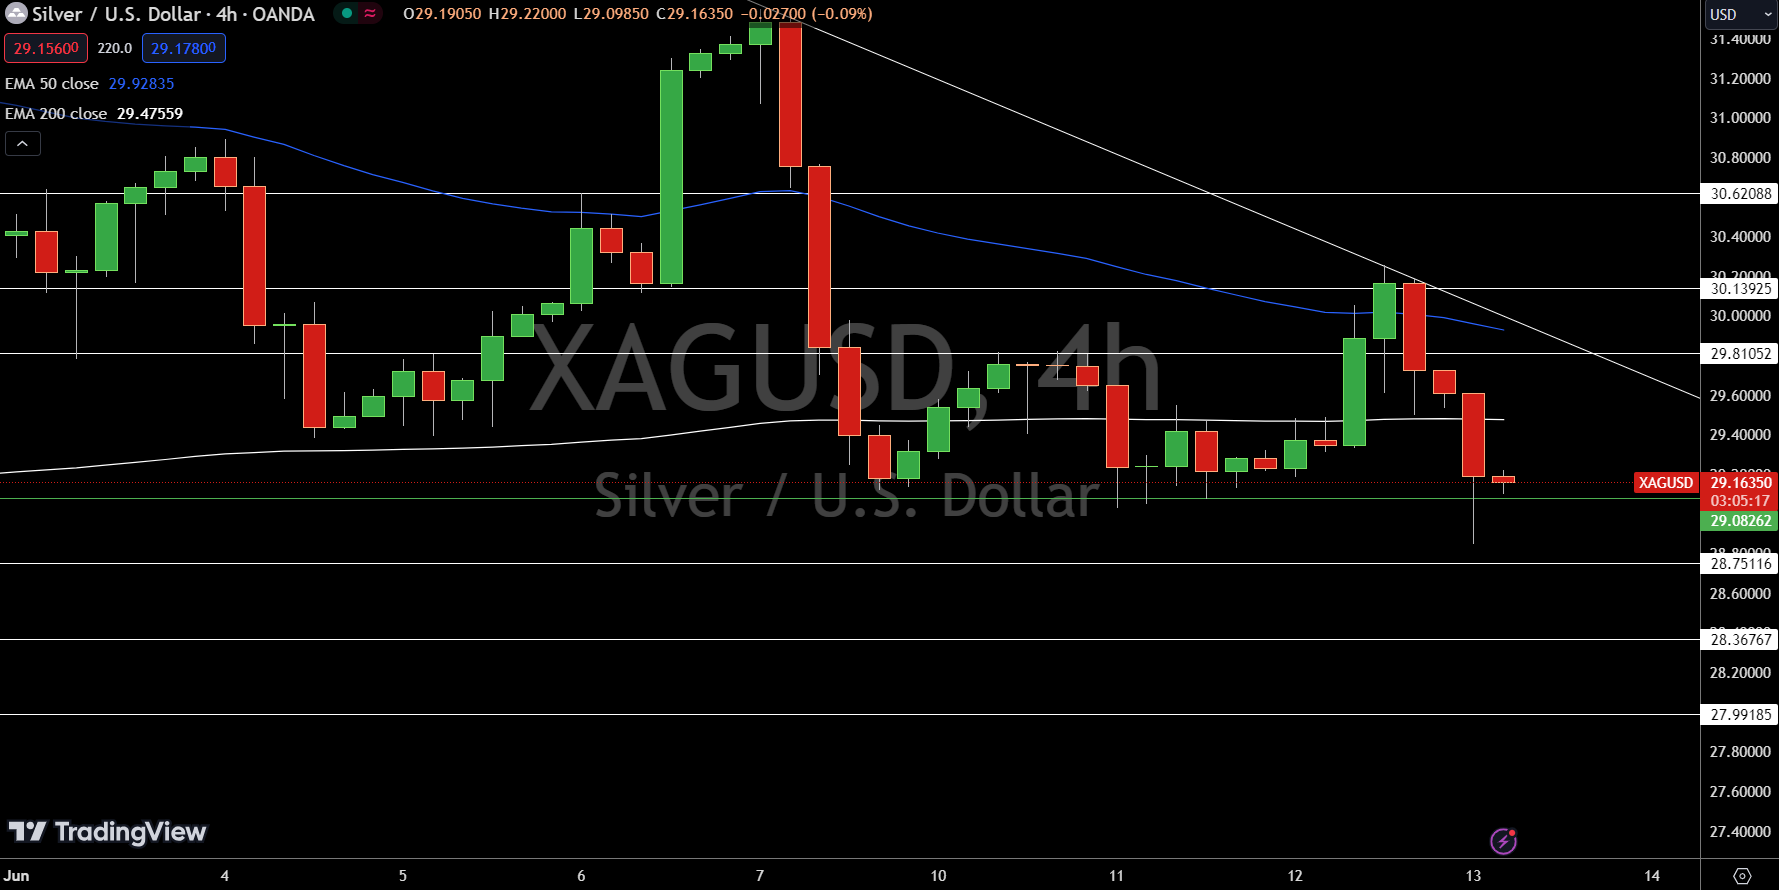
Silver (XAG/USD) is currently trading at $29.16, marking a 0.30% increase. The pivot point is $29.08, indicating a crucial level for upcoming movements. Immediate resistance levels are set at $29.81, $30.14, and $30.62. On the downside, support levels are identified at $28.75, $28.37, and $27.99.
The 50-day Exponential Moving Average (EMA) is at $29.93, while the 200-day EMA is at $29.48, both indicating resistance zones. Technical indicators suggest a bearish outlook below $29.85. A break above this level could signal a bullish trend.