Hot Inflation Data Could Pin Silver Down This Week
Spot Silver (XAGUSD) started the shortened week with a slight uptick as traders continued to defend support at $74.63. That level has held for nine straight weeks. The problem is what sits on the calendar Thursday morning.
The Bureau of Economic Analysis releases April Core Personal Consumption Expenditures data and the second estimate of first-quarter GDP at 12:30 GMT on May 28.
Both reports land on the same morning and both feed directly into the rate cut timeline that is running this market. Oil-driven inflation from the Iran conflict is still pushing through the numbers and that is the reason silver cannot get out of its own way.

The Rate Story Has Silver Pinned
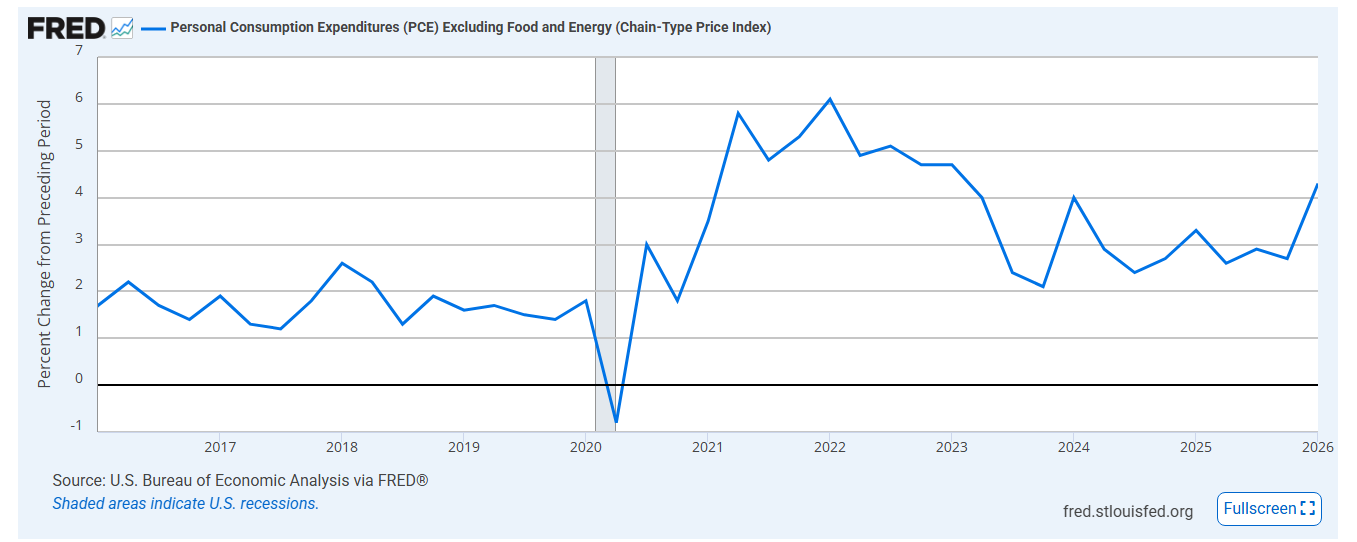
Economists expect the Core Personal Consumption Expenditures month-over-month number to come in around 0.3%. That keeps the year-over-year rate well above the Federal Reserve’s 2% target. Consensus for second-quarter Core Personal Consumption Expenditures has been revised up to roughly 3.4% year-over-year from earlier estimates near 2.7%. The Cleveland Fed’s nowcast is projecting May Core Personal Consumption Expenditures near 3.36% year-over-year. Those are not numbers that give Kevin Warsh room to talk about rate cuts.
A print at or above 0.3% keeps the higher-for-longer policy stance intact. That lifts the U.S. Dollar Index, raises the cost of holding silver, and takes rate cut expectations further off the table. Silver has been trading on rate expectations all year and a hot Core Personal Consumption Expenditures number is the worst print this market can get right now.
Oil Keeps Feeding the Inflation Problem

The U.S.-Iran conflict is still at the center of the inflation picture. Fighting pushed oil prices higher through risks to key shipping routes and that drove gasoline and energy costs up across the board. Those higher energy prices do not stay in the oil market. They pass through into everyday goods, manufacturing costs, and transportation. That keeps overall inflation elevated and it keeps the Fed locked in place.
This energy-driven inflation channel has done more damage to silver than anything else in 2026. The traditional safe-haven argument does not work when the same conflict that should be driving safe-haven demand is also keeping inflation hot enough to prevent rate cuts. Silver cannot rally on war fears when war fears are the reason rates stay elevated. That contradiction has been the story all year and Thursday’s data will tell traders whether it is getting better or worse.
Silver Price Forecast
Every new Silver analysis as it publishes, today's technical signal and key levels, live price — on one page.
See all Silver forecastsIndustrial Demand Is Real but Rates Are Louder
Silver still has the industrial story that separates it from gold. Solar installations, electronics, and electric vehicle production all pull on physical supply and that demand is not going away. The GDP second estimate coming Thursday is relevant here. The advance number showed 2.0% annualized growth in the first quarter, up from 0.5% in the fourth quarter. A stronger revision supports the industrial demand case for silver.
The problem is that solid growth paired with hot inflation locks in tighter policy expectations. An economy that is growing and inflating at the same time gives Warsh no cover to cut. Industrial demand puts a floor under silver on the structural side but it is not strong enough to overcome the rate pressure in the near term. The floor holds. The ceiling stays low.
Thursday’s Data Decides the Week
Core Personal Consumption Expenditures is the Federal Reserve’s preferred inflation gauge and Thursday’s print is the most important data point silver traders will see this month. A reading above 0.3% monthly confirms that inflation is still too sticky for easing. That sends the U.S. Dollar Index higher and silver lower. A surprise to the downside reopens the rate cut conversation and gives silver room to move.
Memorial Day thins out the early part of the week. Any surprises in the numbers or fresh developments from the Iran talks on a thin book will stretch price swings more than normal. The data and the geopolitics are landing on the same week and both of them feed into the same question: does the Fed have room to move or not. Silver’s direction for the next month could come out of Thursday morning.
Weekly Spot Silver (XAGUSD) Technical Analysis

Spot Silver (XAGUSD) started the new week with an uptick as traders continued to show respect for support at $74.63. The market has been straddling this line for nine weeks, indicating that trader reaction to this level is likely to set the tone for the week.
The main trend is down according to the weekly swing chart. A trade through $96.43 will change the main trend to up. A move through $61.01 reaffirms the downtrend.
The minor trend is up. This has shifted momentum slightly to the upside. A trade through $89.38 will reaffirm the minor trend. Taking out $70.86 will change the minor trend to down and shift momentum to the downside.
The long-term uptrend is well-supported by the 52-week moving average at $60.33, which may be supporting the “buy-the-dip” strategy.
The long-term range is $45.55 to $121.67. Since early February the market has spent a tremendous amount of time straddling its retracement zone at $83.61 to $74.63.
The intermediate range is $121.67 to $61.01. Its retracement zone at $91.34 to $98.50 is a potential upside target area.
This week, I think the direction of the market will be determined by trader reaction to the 61.8% level at $74.63. A sustained move over this level will indicate the presence of buyers. This could produce a rally, but the move is likely to be labored due to the 50% level at $83.61. This price is both resistance and a potential trigger point for an acceleration to the upside.
If buyers fail to defend $74.63 the look for sellers to attempt to drive prices into $70.86. A failure at this level could trigger the start of a steep break. On the radar is the support cluster formed by the main bottom at $61.01 and the 52-week moving average at $60.33.
Weekly Outlook
The 61.8% level at $74.63 has held for nine weeks and that is the line that decides this market’s direction. Thursday’s Core Personal Consumption Expenditures print is the gate. A hot number keeps rates elevated, keeps the U.S. Dollar Index firm, and keeps silver trapped below resistance at $83.61. A soft number reopens the rate cut trade and gives buyers the catalyst they need to push through. Until that data lands, silver stays range-bound between a floor that has held all spring and a ceiling that the rate story will not let it break.
More Information in our Economic Calendar.