Spot Silver Breaks Below 50-Day as Yields and Oil Reverse
Spot Silver (XAGUSD) dropped over $5.00 from Monday’s spike to $78.83. Three straight days of selling pushed the metal below the 50-day moving average at $75.72. The structural bull run that carried silver higher all year just ran into a wall. Rising yields, a stronger U.S. Dollar Index, and a sudden collapse in crude oil prices all landed at the same time. That is not a pullback. That is a repricing.
Oil Crashed. Silver Followed.
Crude oil started the whole move. West Texas Intermediate crude oil futures broke down from triple-digit highs and pushed toward $91.36 a barrel. Spot Brent crude oil slid under $100 and moved toward $96.28. The trigger was a reported draft peace agreement between the United States and Iran proposing normalized shipping through the Strait of Hormuz within a month. One headline stripped the war premium out of energy in two sessions flat.
Silver absorbed the full damage. Crude oil is the foundation for global manufacturing and shipping costs. When it collapses this fast the inflation trade unwinds with it. Macro fund managers who were long silver as a geopolitical play started liquidating immediately. The bid disappeared because the reason for the bid disappeared.
Inflation Stayed Hot Anyway
Oil dropped but inflation did not follow. Not yet. Consumer surveys still show near-term inflation expectations at 4.8%. Core components are sticky and the Federal Reserve is not backing down.
Traders are pricing a 76.8% probability that the Fed holds rates in restrictive territory for the rest of the year. That alone keeps silver under pressure. But the market is also pricing a 42% to 51% chance of another rate hike by December. That is the number that matters. Silver does not compete with bonds paying nearly 5%. When the market starts pricing hikes instead of cuts, the entire case for owning precious metals breaks apart. The rate cut story that carried silver to record highs earlier this year is dead and the market is repricing what that means.
Silver Price Forecast
Every new Silver analysis as it publishes, today's technical signal and key levels, live price — on one page.
See all Silver forecastsYields Surged. Dollar Rallied.
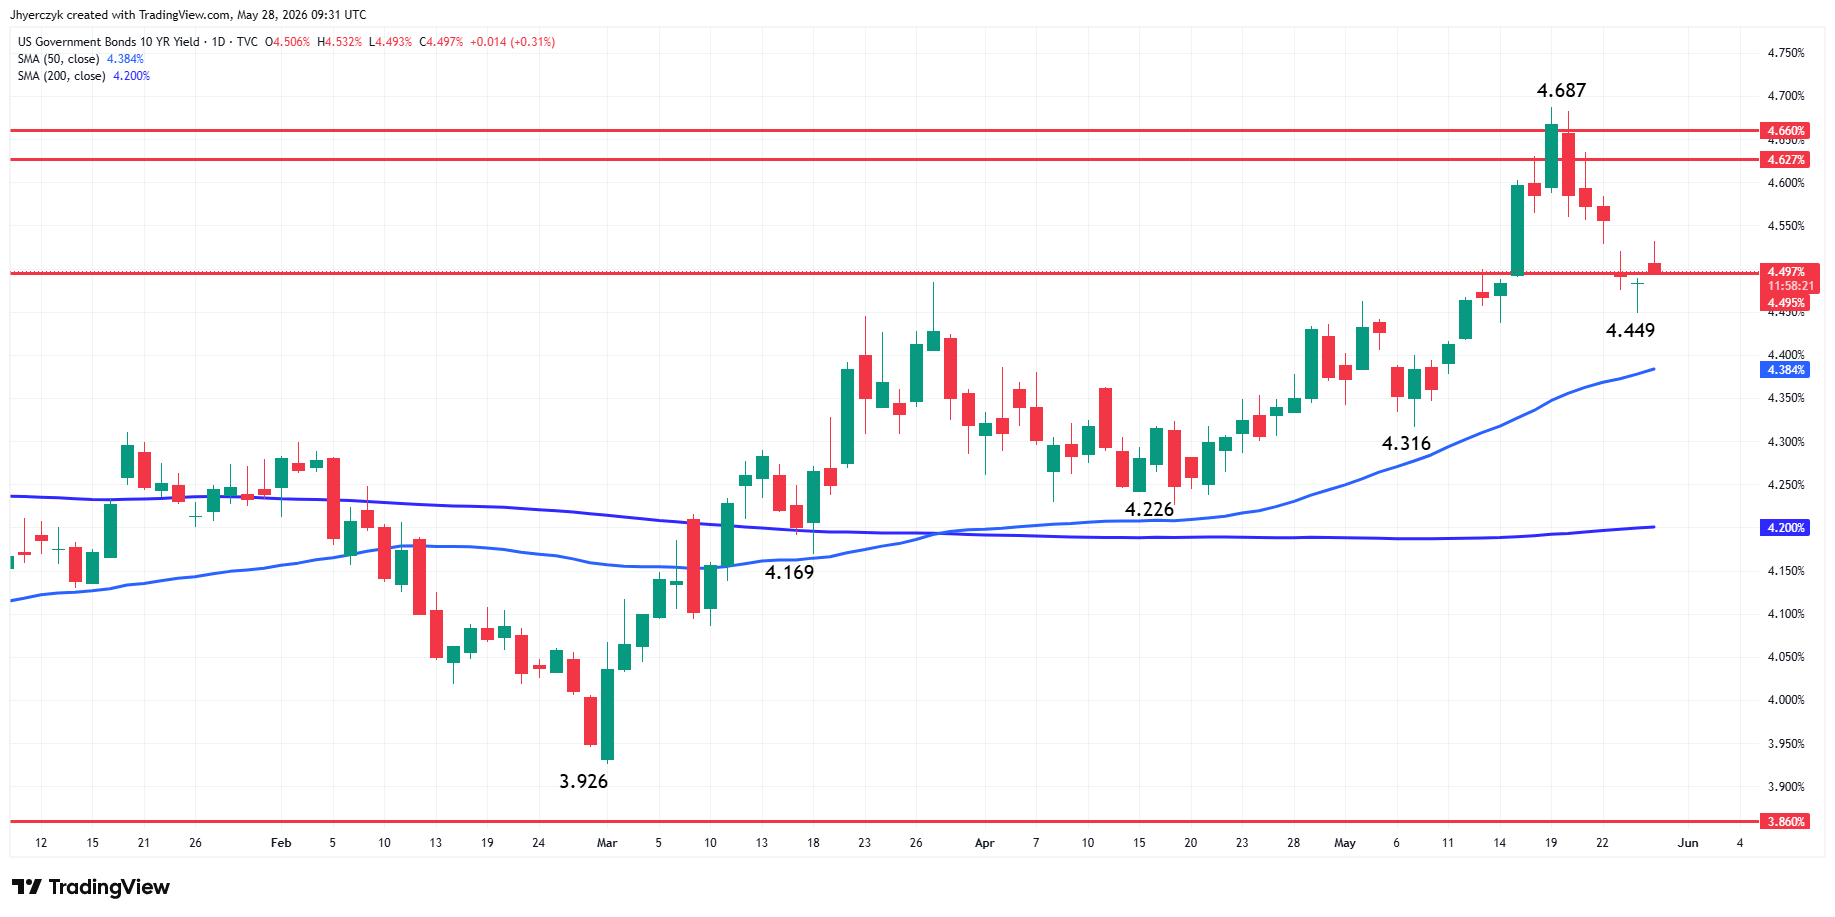
The 10-Year U.S. Treasury yield recently pushed toward 4.687%. The 30-Year U.S. Treasury yield broke above 5.19%. Those are multi-month highs and they are pulling capital directly out of metals. Silver pays nothing. Treasuries pay close to 5%. Institutional money does not sit around debating that trade. It rotates.
The U.S. Dollar Index rallied to a fresh weekly high near 99.544. Silver is priced in dollars globally. A stronger U.S. Dollar Index makes the metal more expensive for every foreign buyer on the board. That crushes demand at the exact moment sellers are already in control.
Daily Spot Silver (XAGUSD) Technical Analysis
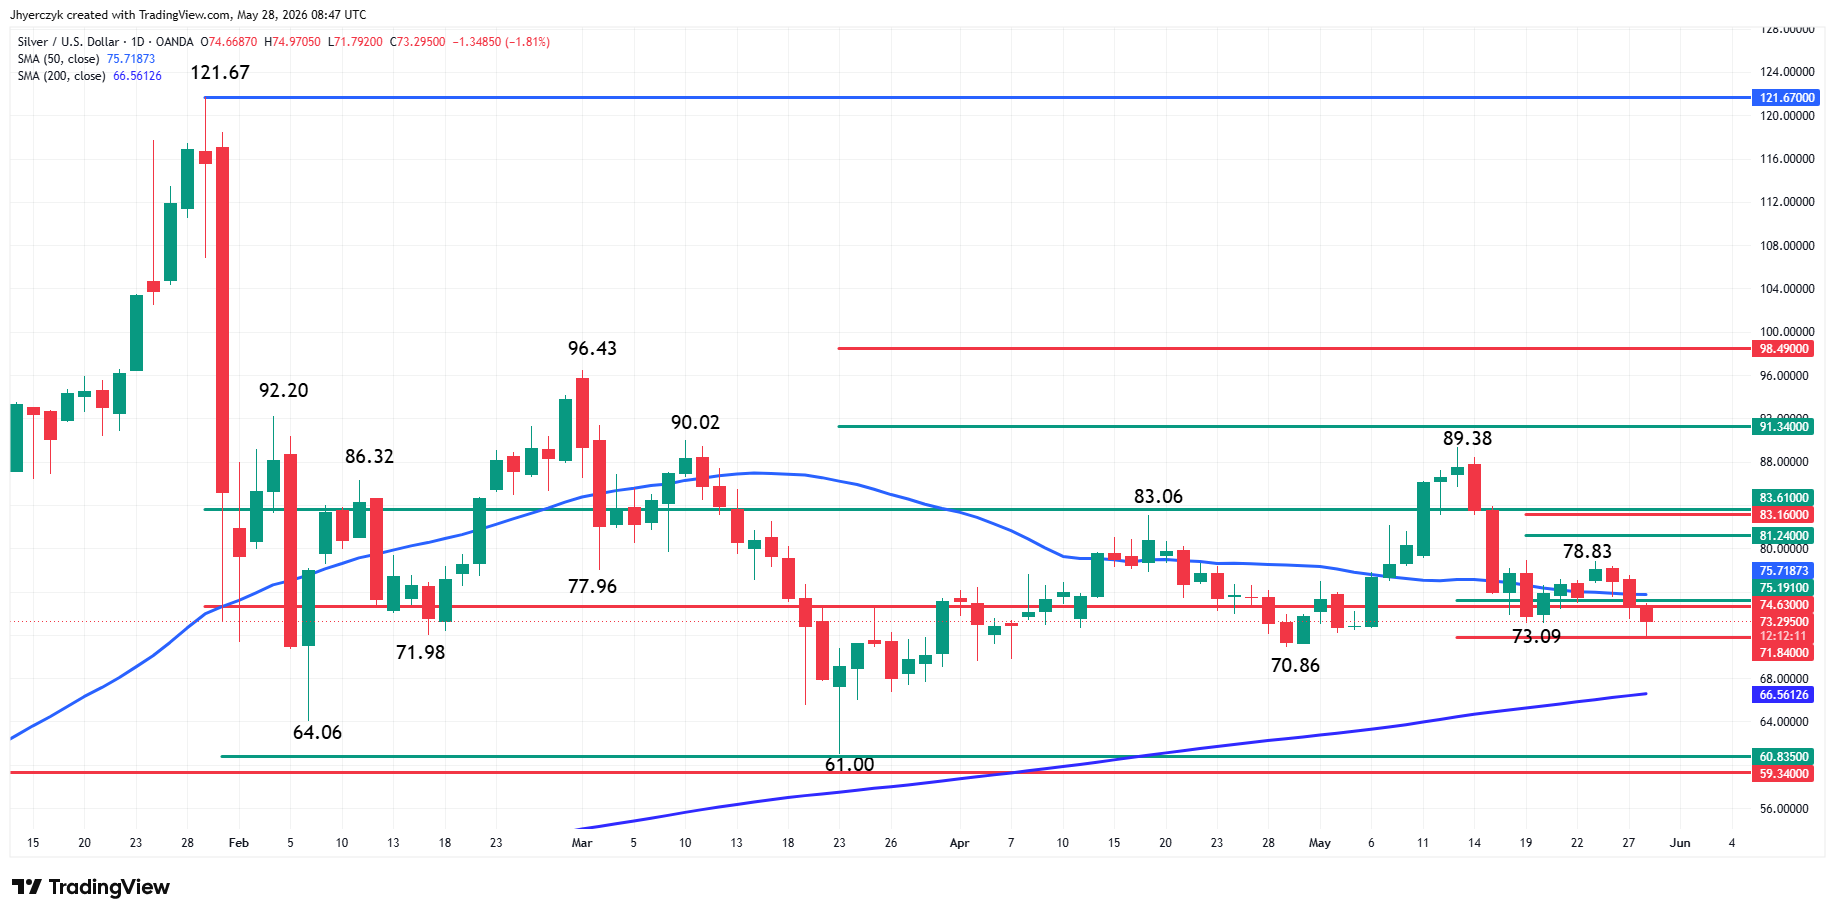
Spot Silver (XAGUSD) is lower on Thursday after spiking through the last bottom at $73.09. The move shifted momentum to the downside with $78.83 the new swing top. A trade through this level will shift momentum back to the upside.
The market is also trading on the weak side of a long-term 61.8% level at $74.63 and a short-term 50% level at $75.19, making them both new resistance. Earlier today, sellers tested a minor 61.8% level at $71.84, driving the market to an intraday low at $71.79. The move was attractive to some traders, producing a technical bounce. At 08:56 GMT, the market stands at $73.26, down 1.89%.
While the retracement levels are nice to know if you’re day trading, the main focus should be on the 50-day moving average at $75.72 and the 200-day moving average at $66.56. The 50-day MA has been the most active since early February, mostly acting like a pivot for breakouts and breakdowns. For the past two weeks, Spot Silver has been straddling this indicator while traders searched for a catalyst.
Today, Spot Silver is clearly trading on the weak side of the 50-day MA, making it resistance. The daily chart indicates that a break under the swing bottom at $70.86 could be the trigger point for an acceleration into the 200-day moving average at $66.56. This indicator is controlling the long-term direction.
GDP and PCE Set the Next Move
Today’s double release from the Bureau of Economic Analysis is the gate. The second estimate for first-quarter Gross Domestic Product is expected at 2.0% annualized. The April Personal Consumption Expenditures index, the Federal Reserve’s preferred inflation gauge, is forecast to accelerate from 3.5% to 3.8% year-over-year.
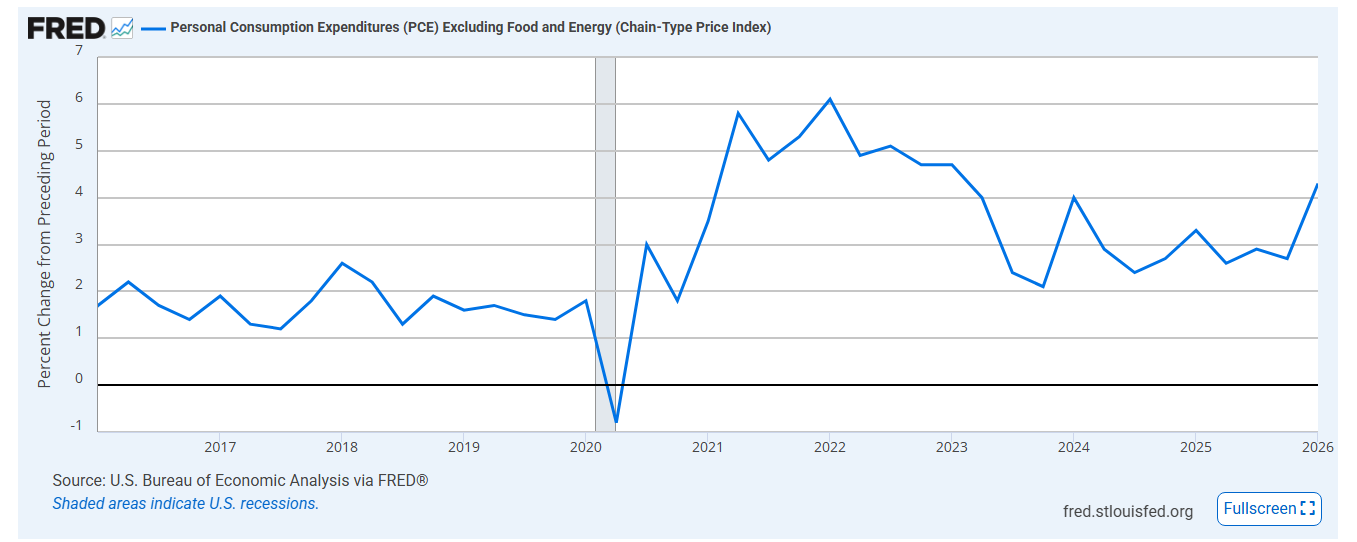
If the Personal Consumption Expenditures index prints above 3.9% or core breaks 3.4%, that cements the higher-for-longer stance completely. The 10-Year U.S. Treasury yield pushes past 4.75% in that scenario and the U.S. Dollar Index runs toward 100.00. Silver takes another leg lower because the market prices out every remaining hope of easing this year. The way I see it, a hot print here sends Spot Silver (XAGUSD) straight at the 200-day moving average at $66.56 with nothing in between to slow it down.
A dovish surprise changes the picture fast. If Gross Domestic Product cools below 1.8% and the Personal Consumption Expenditures index decelerates toward 3.3%, the U.S. Dollar Index rally breaks, yields pull back hard, and short covering rips through metals. Silver’s physical supply deficit takes center stage again and fundamental buyers come back in size. But until today’s numbers hit, sellers are in control and the chart agrees with them.
More Information in our Economic Calendar.