
Advertisement
Advertisement

Small-Cap Resurgence in 2026

By: 
Lucas Downey
Bull and trading chart. FX Empire

A new year is bringing in a huge market rotation and new leadership for equities.

Former winners are lagging as left-for-dead names reawaken to climb higher. Some huge technology stocks are being sold, and many smaller stocks are being bought.

But if you’re just looking at the S&P 500 (GSPC), it may not seem evident.

Loading

A Risk-On Rally in Smaller Companies

There is a catchup trade happening and small companies are at the heart of it.

Small-cap stocks have been out of favor for years, but they’re making a comeback. In fact, the Russell 2000 (RUT) is now beating the S&P 500 and the Nasdaq 100 (NDX) in all timeframes over the last year:
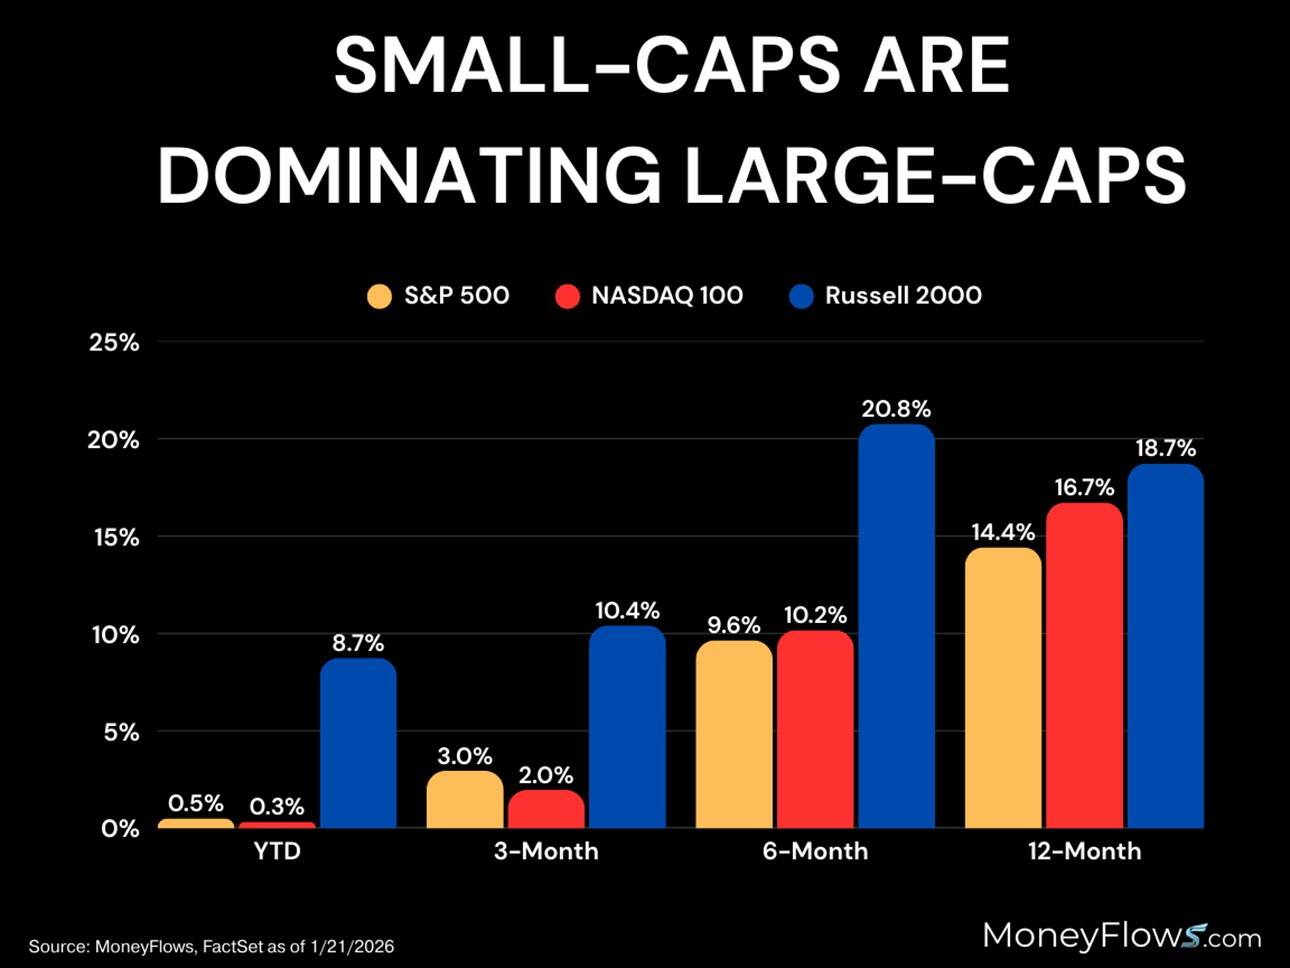
Bar chart comparing 12-month, 6-month, 3-month, and YTD performance of the S&P 500, Nasdaq 100, and Russell 2000, showing the Russell 2000 outperforming both large-cap indices across all timeframes.
Comparative performance of the Russell 2000, S&P 500, and Nasdaq 100 (YTD through 12-Month) – Source: MoneyFlowys.com, FactSet as of 1/21/2026

Why is that? Much of it has to do with a changing environment.

The general landscape for businesses is improving. Federal Reserve interest rate cuts, a stronger economy, and growing corporate investment are prevalent. It’s unleashed a risk-on rally in smaller companies.

Serious Demand in Two Sectors for Small-Cap Stocks

MoneyFlows data shows where Big Money investors are pouncing.

Looking at the 2026 action from a market capitalization standpoint, investors have been bullish in general. More specifically, there’s a healthy appetite for smaller companies:
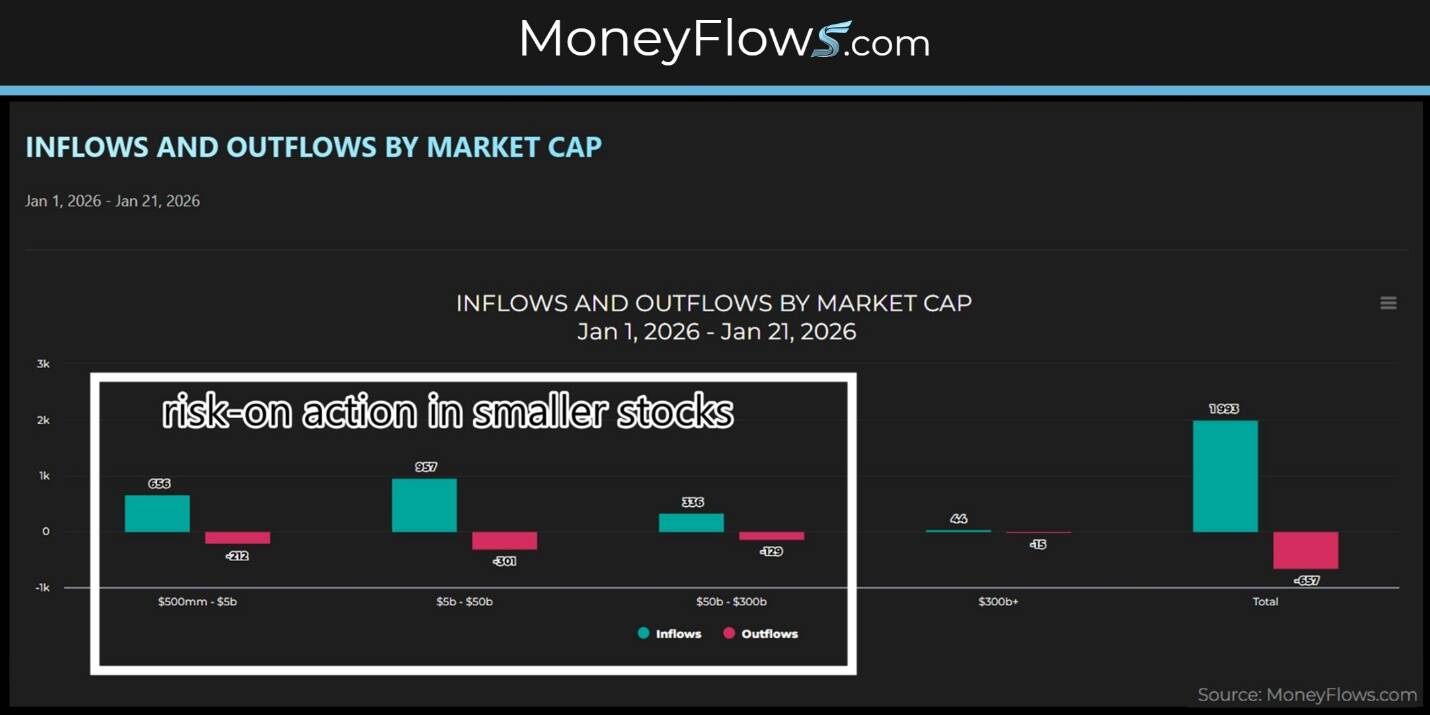
Bar chart titled 'Inflows and Outflows by Market Cap' for the period Jan 1 to Jan 21, 2026. The chart shows significantly higher net inflows for smaller market cap categories ($500mm to $50b) compared to mega-cap stocks ($300b+), supporting the visual note of 'risk-on action in smaller stocks.
Inflows and Outflows by Market Cap (Jan 1–21, 2026), showing risk-on action in smaller stocks – Source: MoneyFlows.com.

Sector strength has shifted too.

For most of 2025, technology led the way. Now technology and communications have fallen as energy, materials, and industrials soar:
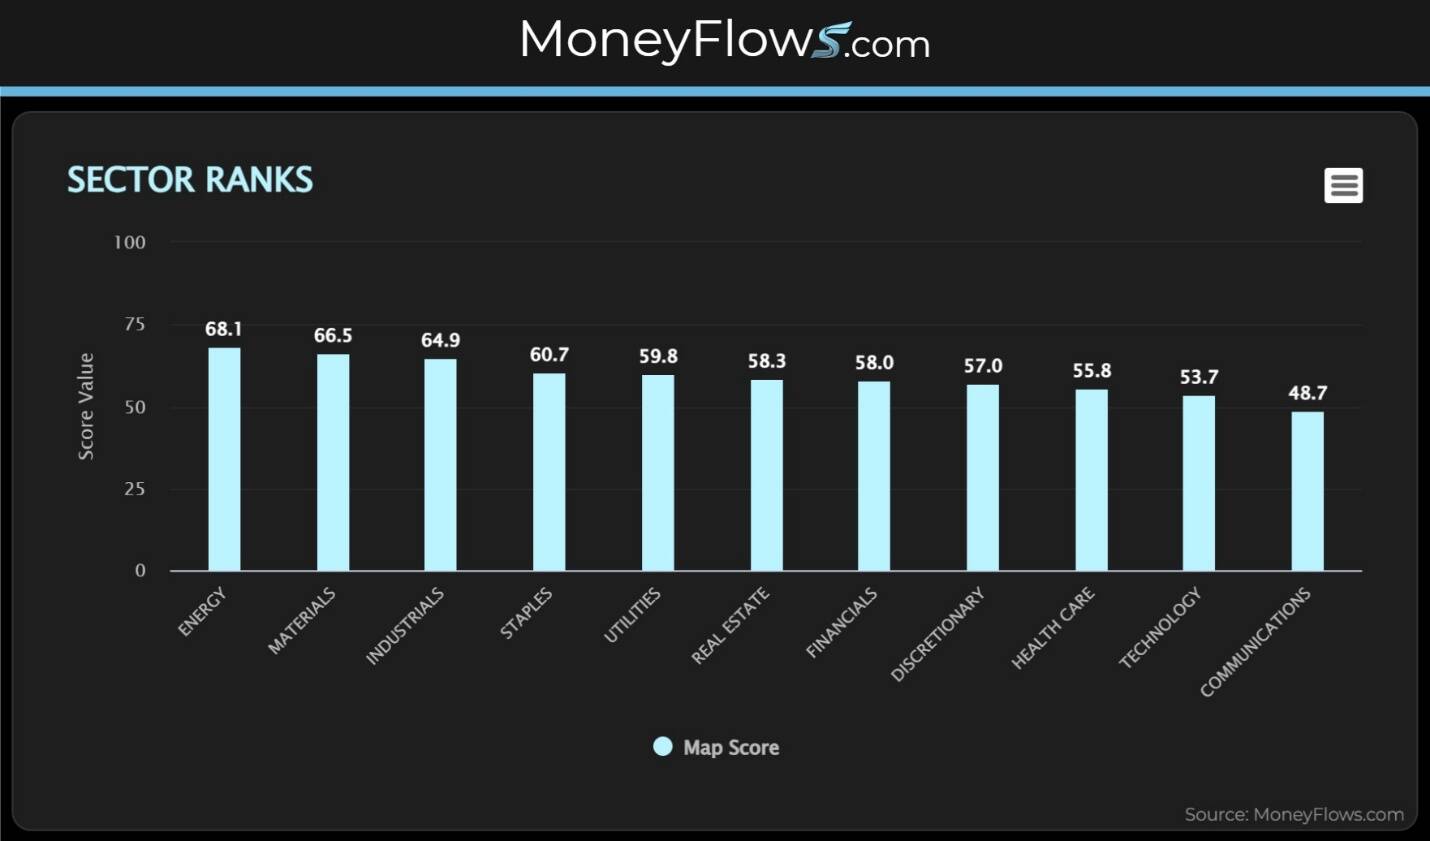
Bar chart titled 'Sector Ranks' showing relative market performance scores for eleven sectors. Energy, Materials, and Industrials lead with scores of 68.1, 66.5, and 64.9 respectively, while Technology (53.7) and Communications (48.7) rank at the bottom.
Sector Ranks by Performance Score – Source: MoneyFlows.com

MoneyFlows data reflects serious demand for small-cap tech and discretionary stocks.

For instance, ACM Research, Inc. (ACMR) is a $3.4 billion company that develops, manufactures, and sells semiconductor processing equipment. Three-year sales growth is 44.5%, while three-year earnings growth is 41.6%.

No wonder Big Money is buying:
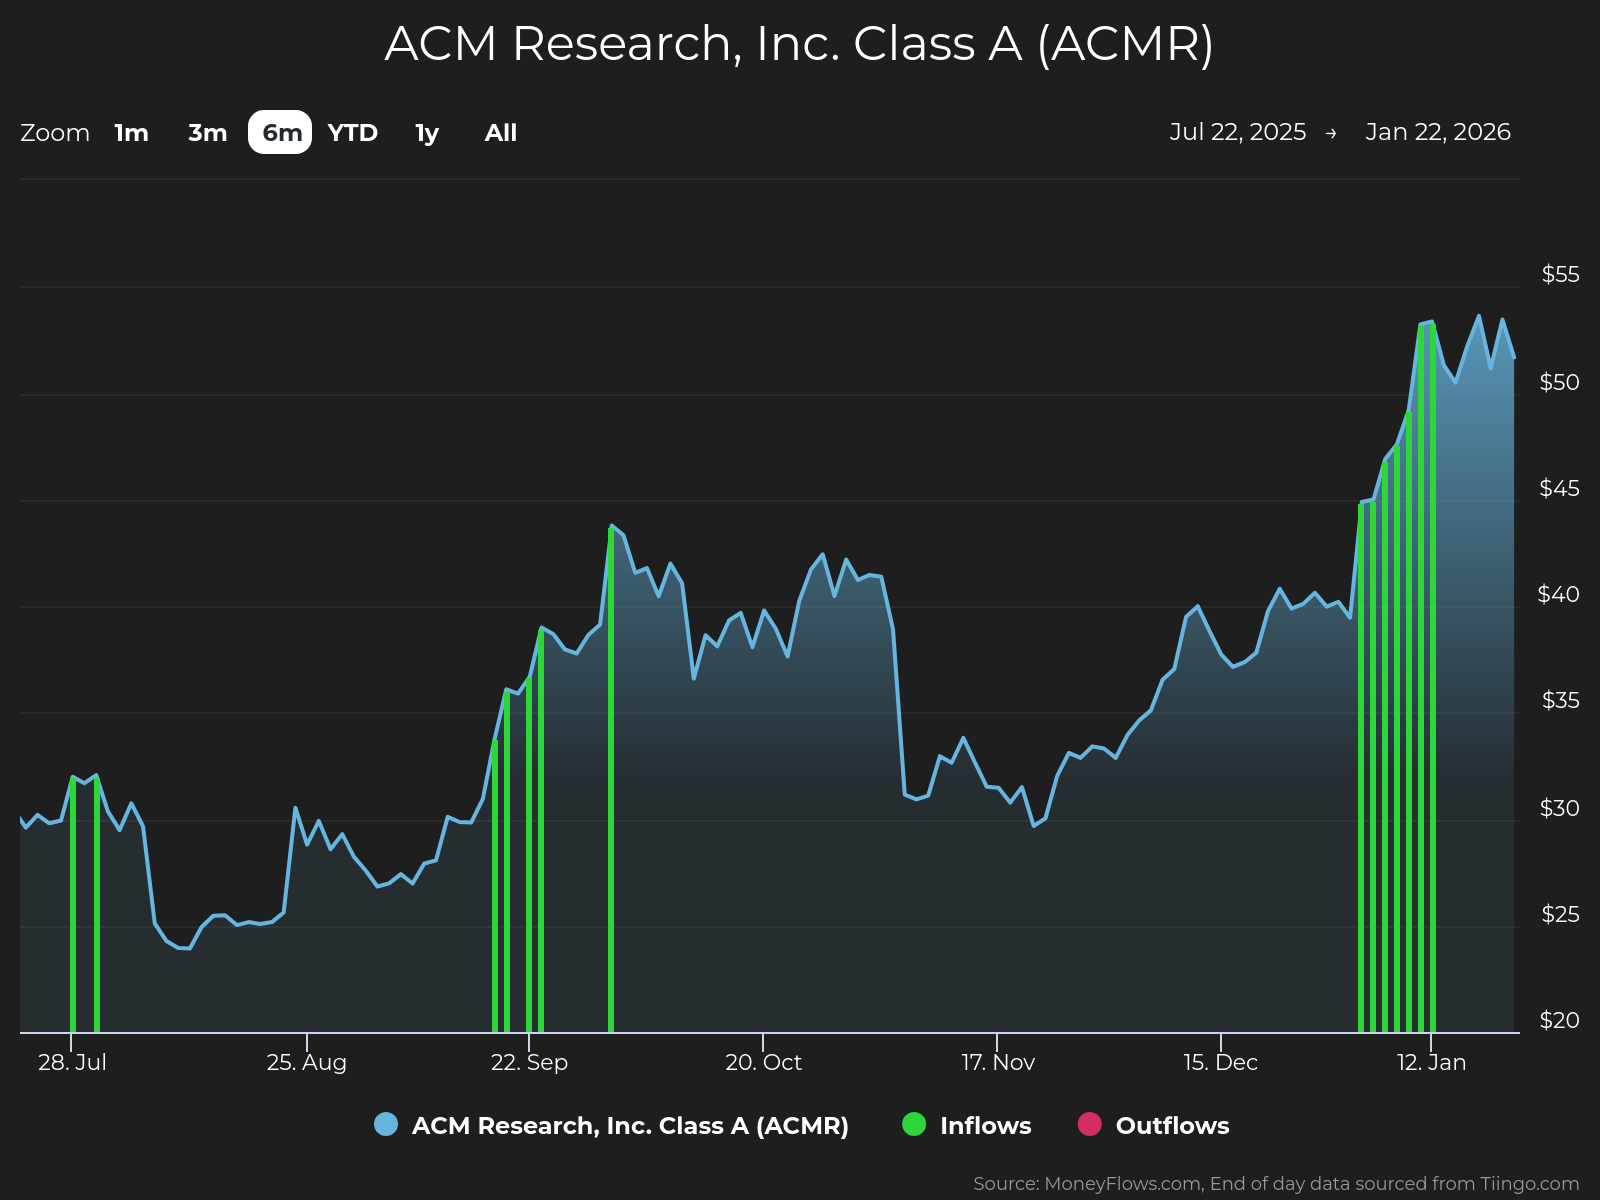
Six-month stock price chart for ACM Research (ACMR) showing a strong uptrend from late 2025 into January 2026. The chart includes a MoneyFlows overlay showing significant net inflows as the price reached new 52-week highs near $56.
ACM Research, Inc. Class A (ACMR) 6-month performance and money flows – Source: MoneyFlows.com as of Jan 22, 2026

Media company Fox Corporation (FOXA) has a market cap of $32.1 billion and has been a Big Money target too:
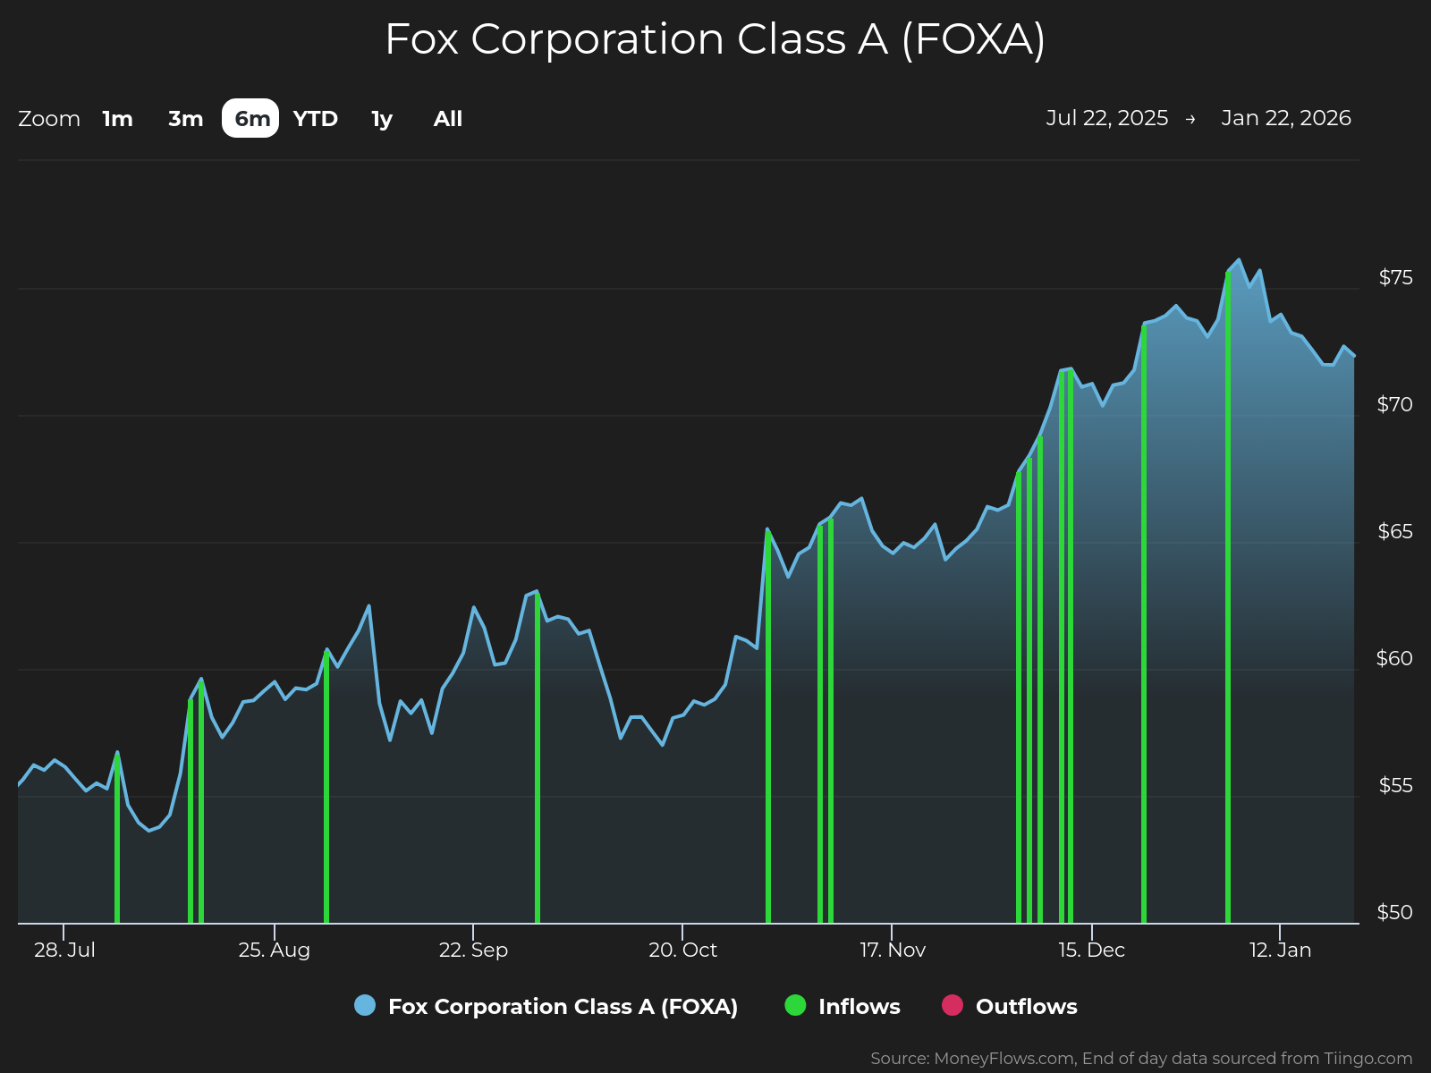
Six-month price trend chart for Fox Corporation (FOXA) from July 2025 to January 2026. The stock shows a steady climb from $55 to over $70, with frequent green vertical 'Inflow' signals appearing during the sharpest parts of the rally in late 2025.
Fox Corporation (FOXA) 6-month performance and money flows – Source: MoneyFlows.com as of Jan 22, 2026

It’s not surprising considering the company’s one-year sales growth of 16.6% and three-year per-share earnings growth of 34.2%.

Another media company seeing inflows is the New York Times Company (NYT). This $11.6 billion organization has a three-year EPS growth rate of 13.9%, three-year sales growth of 7.6%, and an 11.4% profit margin.

Look at the inflows:
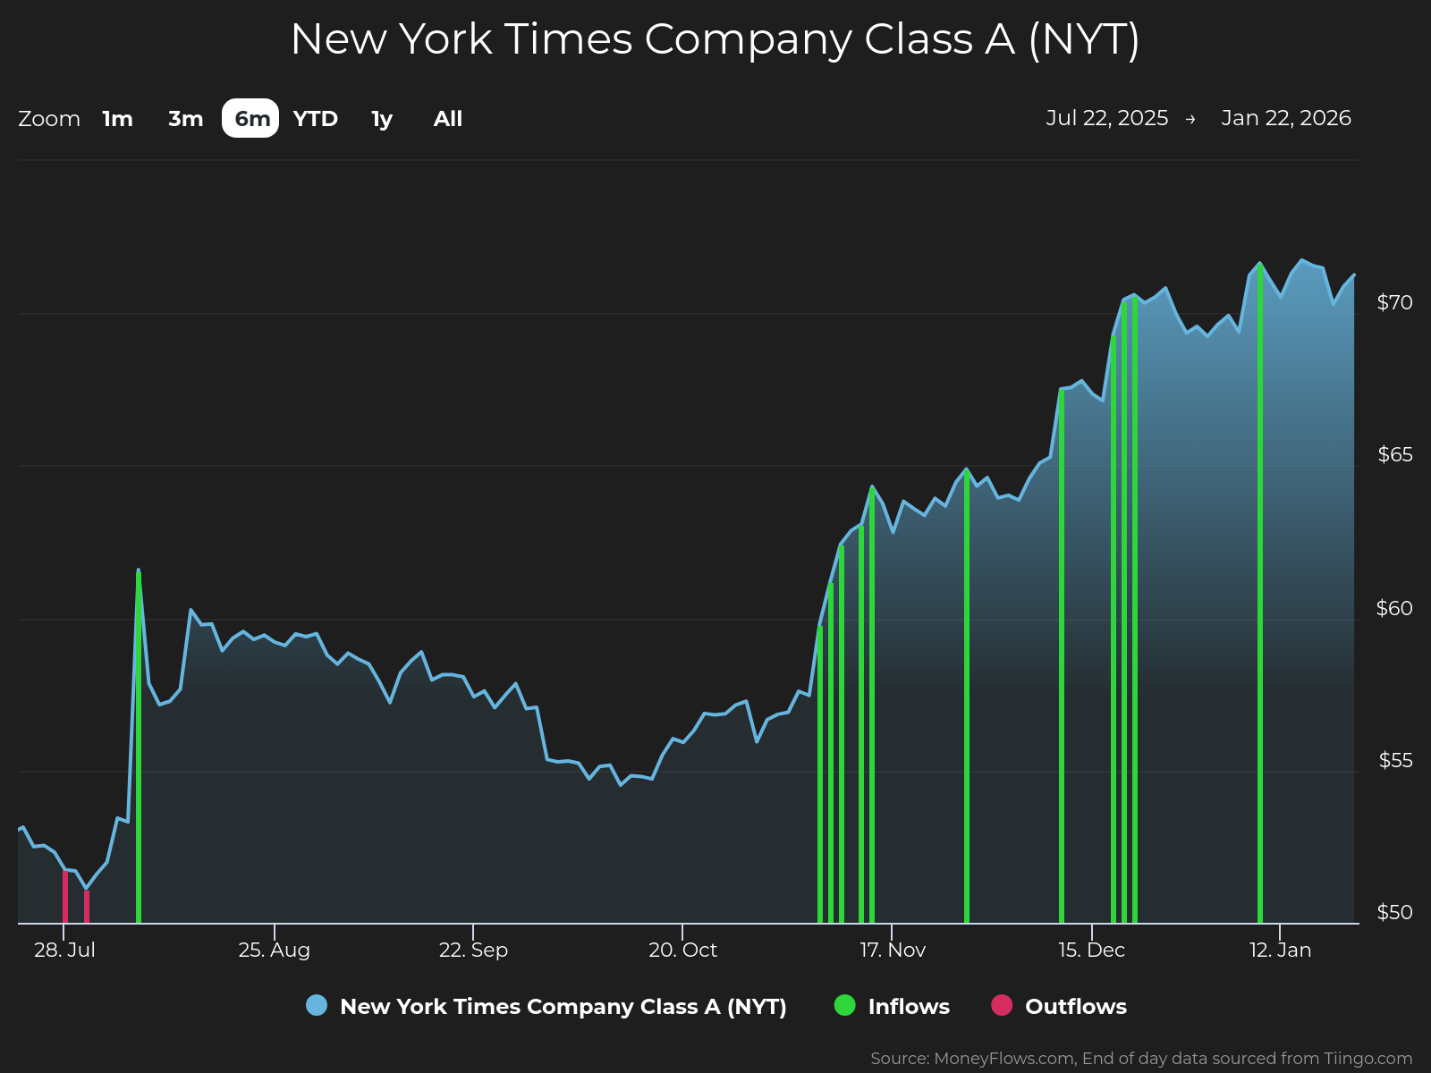
Six-month stock price chart for the New York Times Company (NYT) from July 2025 to January 2026. The price shows a steady climb from approximately $52 to over $70, with a significant cluster of green 'Inflow' signals in November and December 2025 supporting the upward momentum.
New York Times Company Class A (NYT) 6-month performance and money flows – Source: MoneyFlows.com as of Jan 22, 2026

Lastly, Rambus, Inc. (RMBS) is a $13.4 billion tech company focused on semiconductors and high-performance memory applications. Its shares have nearly doubled in the last six months thanks to institutional inflows:
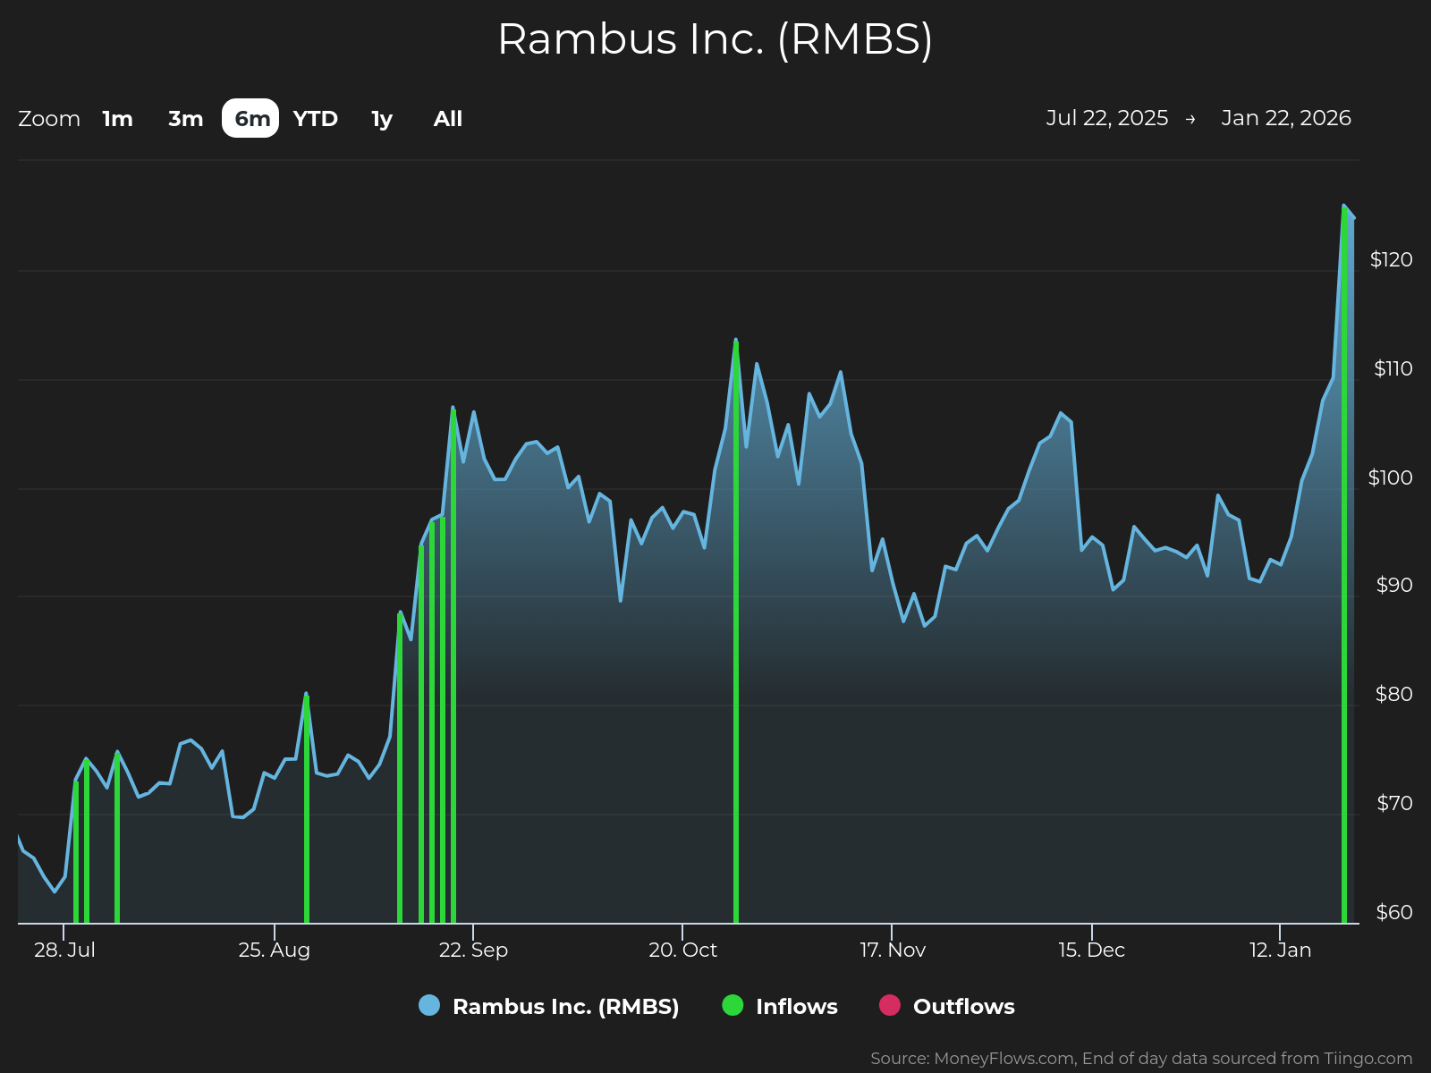
Six-month stock price chart for Rambus Inc. (RMBS) from July 2025 to January 2026. The chart shows high volatility with a massive vertical surge in January 2026, taking the price from approximately $90 to a peak near $130, supported by multiple green 'Inflow' signals during major rallies.
Rambus Inc. (RMBS) 6-month performance and money flows – Source: MoneyFlows.com as of Jan 22, 2026

Big Money is drawn to the company because it’s grown sales by 20.2% over the last three years, has minimal debt, and is expected to grow EPS by 19.2% in the next year.

Find New Leaders

Maybe you’ve heard those names, maybe you haven’t. None were market leaders in 2025.

But it’s 2026 and time to find new leaders. This is where MoneyFlows shines. See the stocks soaring while indexes sputter.

If you are a Registered Investment Advisor (RIA) or a serious investor, take your investing to the next level and follow our free weekly MoneyFlows insights.

Disclosure: the author holds no positions in ACMR, FOXA, NYT, or RMBS at the time of publication.

Loading

About the Author

Lucas Downeycontributor

Lucas is a well-versed equity investor and educator. He currently is co-founder of research and analytics firm, MAPsignals.com, which focuses on finding outlier stocks by following the Big Money.

Latest news and analysis

    Loading
Advertisement
Loading
Advertisement
Advertisement
Advertisement
Advertisement