The S&P 500 fell initially during the day on Friday but turned around as we continue to find buyers every time this market dips. The S&P 500
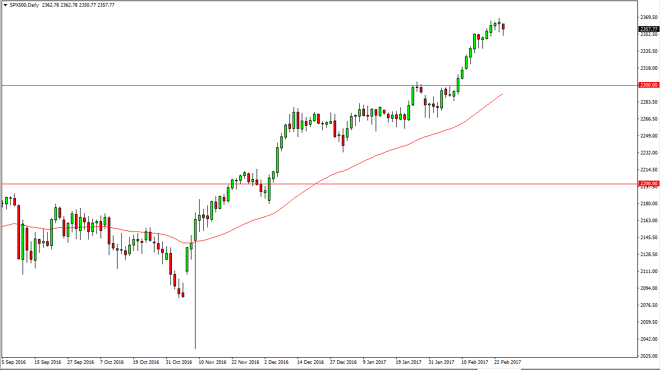
The S&P 500 fell initially during the day on Friday but turned around as we continue to find buyers every time this market dips. The S&P 500 should continue to go higher over the longer term and I believe there’s an absolute floor at 2300. The 2340 level also offer support, so I think short-term pullbacks are only get to be looked at as value. Given enough time, the market should then reach towards the 2500 level above, but is can you take quite some time together as we are so overbought. I have no interest in shorting this market.
Chris is a proprietary trader with more than 20 years of experience across various markets, including currencies, indices and commodities. As a senior analyst at FXEmpire since the website’s early days, he offers readers advanced market perspectives to navigate today’s financial landscape with confidence.