The S&P 500 initially fell during the day on Tuesday, turning around to form a hammer. The hammer of course is a bullish sign, and if we can break out
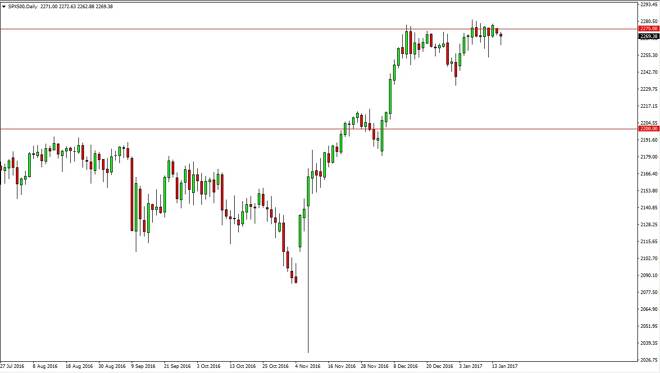
The S&P 500 initially fell during the day on Tuesday, turning around to form a hammer. The hammer of course is a bullish sign, and if we can break out to refresh, new high, the market should continue to go higher. This is a longer-term uptrend, and thus it’s only a matter time before the buyers take over. If we continue to see buyers jump into this market, I feel it’s only a matter time before we go higher. The 2250 level underneath continues to be the “floor” in this market going forward.
Chris is a proprietary trader with more than 20 years of experience across various markets, including currencies, indices and commodities. As a senior analyst at FXEmpire since the website’s early days, he offers readers advanced market perspectives to navigate today’s financial landscape with confidence.