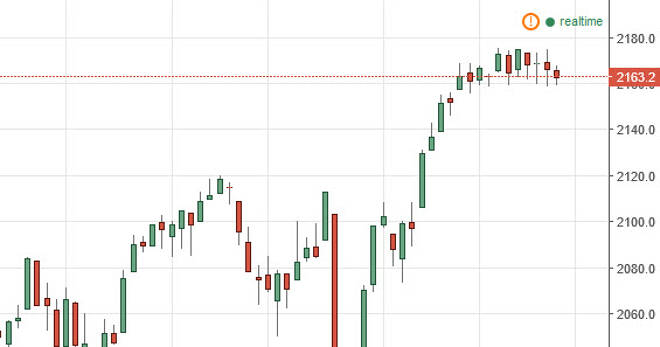
The S&P 500 fell slightly during the course of the session on Thursday, testing the 2160 handle. We bounce slightly in order to form a little bit of a
The S&P 500 fell slightly during the course of the session on Thursday, testing the 2160 handle. We bounce slightly in order to form a little bit of a hammer, but at this point in time it looks as if we are going to simply grind sideways overall. With this, I also recognize that there is a lot of support below here, especially the 2120 handle. A break above the top of the recent consolidation area, roughly the 2180 handle, since this market higher as well. I have no interest whatsoever in selling the S&P 500.
Chris is a proprietary trader with more than 20 years of experience across various markets, including currencies, indices and commodities. As a senior analyst at FXEmpire since the website’s early days, he offers readers advanced market perspectives to navigate today’s financial landscape with confidence.