The S&P 500 initially tried to rally on Tuesday, but turned around to form a negative candle. The 20-day exponential moving average is just below, and
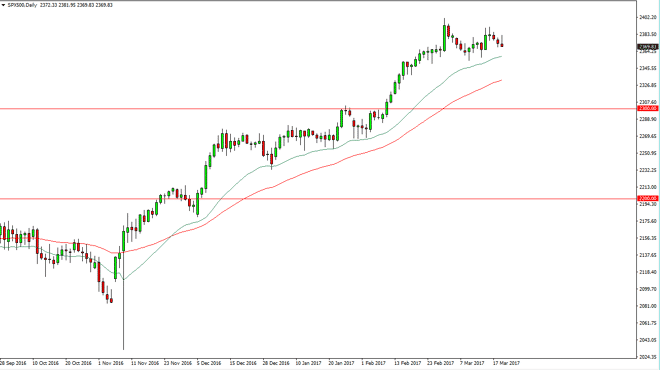
The S&P 500 initially tried to rally on Tuesday, but turned around to form a negative candle. The 20-day exponential moving average is just below, and it now looks as if the market is testing that area again, and it is a level that has been very reliable. I believe that the market will find buyers sooner rather than later, and I am bullish of this market in general. However, now I believe we are simply consolidating as we had a very strong moved to the upside lately. I’m buying bounces and of course supportive candles.
Chris is a proprietary trader with more than 20 years of experience across various markets, including currencies, indices and commodities. As a senior analyst at FXEmpire since the website’s early days, he offers readers advanced market perspectives to navigate today’s financial landscape with confidence.