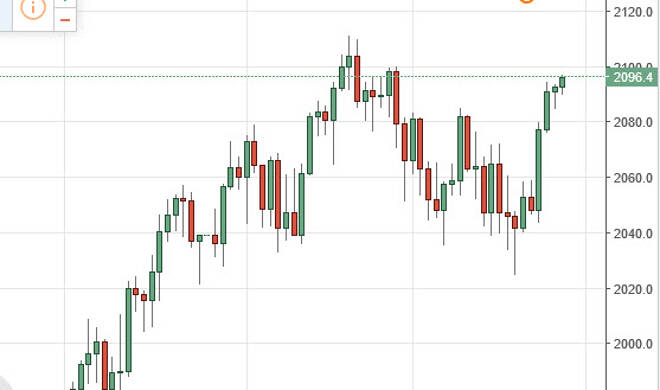
The S&P 500 initially fell during the course of the day on Friday, but turn right back around to show quite a bit of bullish pressure in it. The 2100
The S&P 500 initially fell during the course of the day on Friday, but turn right back around to show quite a bit of bullish pressure in it. The 2100 level above is resistive, but it appears that we are trying to break out to the upside given enough time. With this, we have no interest in selling, and just look at any time the market pulls back as a potential value proposition and what has been a very strong market over the last several sessions, as stock markets in general seem to be flexing their muscles again.Keep in mind that Monday is a holiday though.
Chris is a proprietary trader with more than 20 years of experience across various markets, including currencies, indices and commodities. As a senior analyst at FXEmpire since the website’s early days, he offers readers advanced market perspectives to navigate today’s financial landscape with confidence.