The S&P 500 initially tried to rally during the course of the session on Friday, but turned right back around to form a bit of a shooting star. It
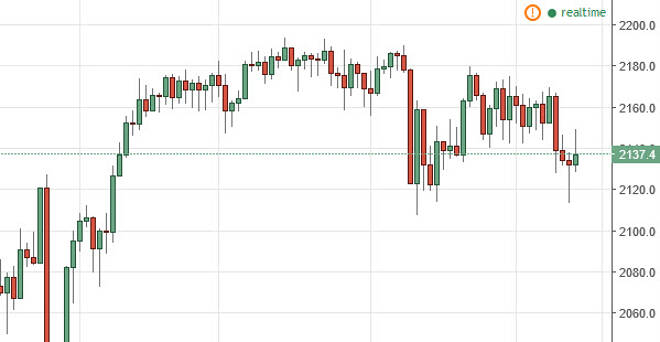
The S&P 500 initially tried to rally during the course of the session on Friday, but turned right back around to form a bit of a shooting star. It looks as if we are going to grind back and forth overall, and continue to show the 2120 level to be supportive. With this, I feel that sooner or later the buyers will get involved, but I also believe that a break above the top of the shooting star would be reason enough to start going long as well. I have no interest in selling this market and believe that sooner or later we will go not only to the recent highs, but higher than that.
Chris is a proprietary trader with more than 20 years of experience across various markets, including currencies, indices and commodities. As a senior analyst at FXEmpire since the website’s early days, he offers readers advanced market perspectives to navigate today’s financial landscape with confidence.