The S&P 500 initially fell during the day is all US indices did, but later in the trading session ended up bouncing enough to form a nice-looking
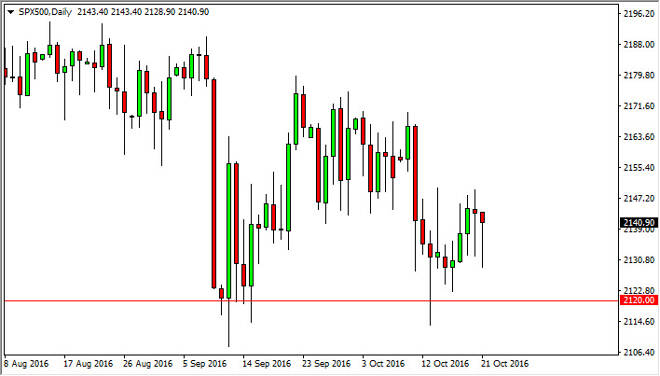
The S&P 500 initially fell during the day is all US indices did, but later in the trading session ended up bouncing enough to form a nice-looking hammer. It appears that the 2120 level below is going to continue to offer support, and with that I think that it’s only a matter of time before we go higher. With this, I am a buyer and I look at pullbacks as potential value in a market that seems to have a “floor” at the 2120 handle below, and extending all the way down to the 2000 level.
Chris is a proprietary trader with more than 20 years of experience across various markets, including currencies, indices and commodities. As a senior analyst at FXEmpire since the website’s early days, he offers readers advanced market perspectives to navigate today’s financial landscape with confidence.