The S&P 500 went back and forth during the course of the day on Friday, showing the 2120 level be supportive yet again. With this being the case, the
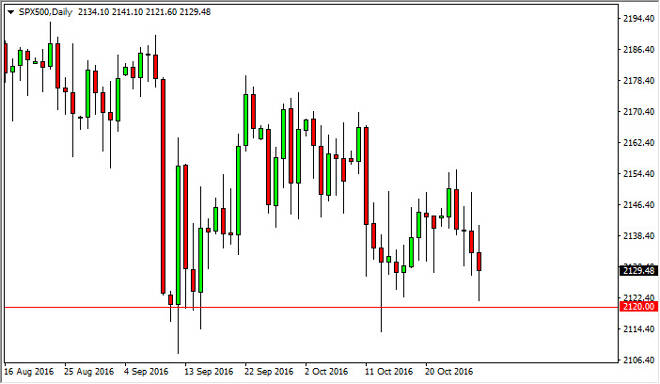
The S&P 500 went back and forth during the course of the day on Friday, showing the 2120 level be supportive yet again. With this being the case, the market looks as if it is trying to make an upward move, but I don’t think we have enough momentum yet. I certainly don’t want to sell this market though; it has such a strong support. I believe that short-term pullbacks offer short-term buying opportunities at this point, and that’s probably about as good as it gets. Regardless, expect quite a bit of volatility.
Chris is a proprietary trader with more than 20 years of experience across various markets, including currencies, indices and commodities. As a senior analyst at FXEmpire since the website’s early days, he offers readers advanced market perspectives to navigate today’s financial landscape with confidence.