The S&P 500 fell during the course of the session here on Monday, breaking down to the 2150 level. There is quite a bit of support just below though,
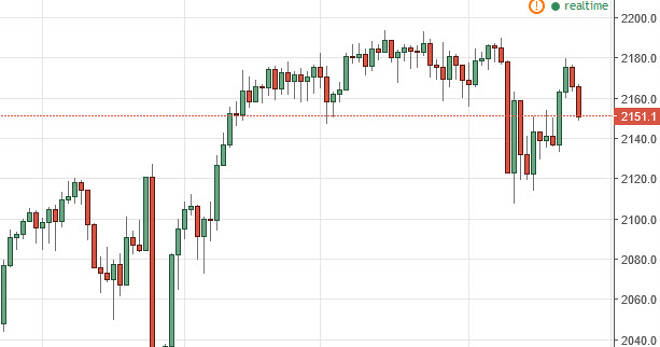
The S&P 500 fell during the course of the session here on Monday, breaking down to the 2150 level. There is quite a bit of support just below though, so sooner or later we are going to see a supportive candle that we can serve buying. I believe that the 2120 level below is the “floor” in this market, and as a result until we get well below the 2100 level that I would consider selling. I do believe that this market will reach back towards the 2200 level, but it may take a little bit of time before that happens.
Chris is a proprietary trader with more than 20 years of experience across various markets, including currencies, indices and commodities. As a senior analyst at FXEmpire since the website’s early days, he offers readers advanced market perspectives to navigate today’s financial landscape with confidence.