The S&P 500 had a positive week, but we continue to drift lower over the last several weeks. However, we are in the middle of earnings season, so it
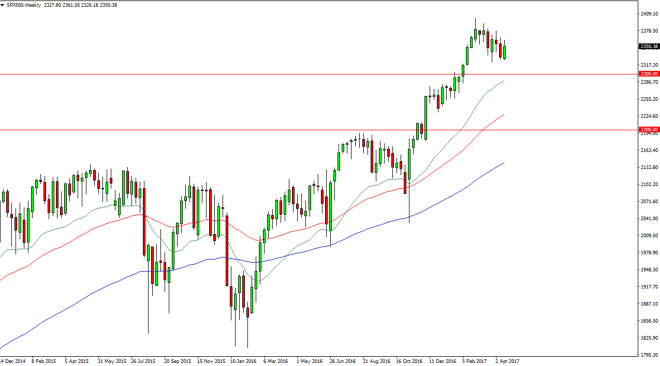
The S&P 500 had a positive week, but we continue to drift lower over the last several weeks. However, we are in the middle of earnings season, so it makes sense that the markets would be a bit tenuous. When I look at the chart, it’s easy to see that an argument can be made for a bullish flag, and that of course could break out to the upside, offering the next leg higher. I believe that the 2400 level will be targeted, the 2300 level will offer support, and quite frankly I have a longer-term target of 2500.
Chris is a proprietary trader with more than 20 years of experience across various markets, including currencies, indices and commodities. As a senior analyst at FXEmpire since the website’s early days, he offers readers advanced market perspectives to navigate today’s financial landscape with confidence.