The S&P 500 initially tried to rally during the course of the week but turned right back around to form a fairly negative candle. By doing so, it
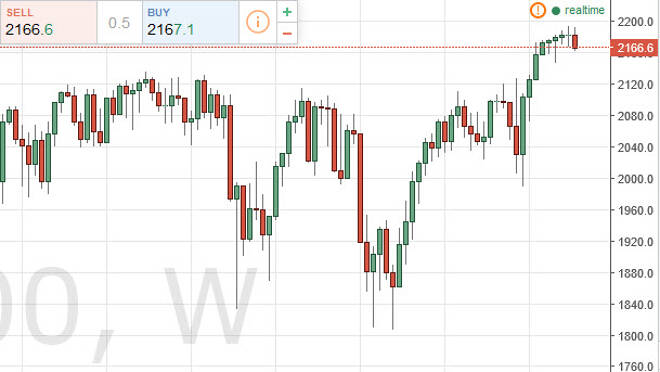
The S&P 500 initially tried to rally during the course of the week but turned right back around to form a fairly negative candle. By doing so, it looks as if the market is still trying to wind itself up in order to pick up enough momentum to continue going higher. I have no interest in shorting this market, and believe that sooner or later we will get a supportive candle were a bounce that we can take advantage of. We still have a target of 2250 in this particular market.
Chris is a proprietary trader with more than 20 years of experience across various markets, including currencies, indices and commodities. As a senior analyst at FXEmpire since the website’s early days, he offers readers advanced market perspectives to navigate today’s financial landscape with confidence.