The S&P 500 initially fell during the week, but turned around to form a hammer. A hammer of course is a bullish sign and thus I think that we will
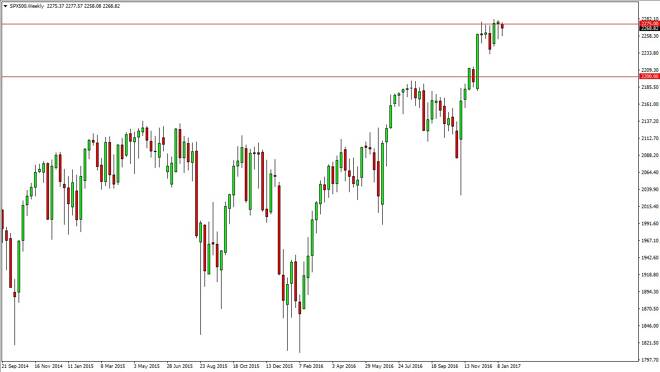
The S&P 500 initially fell during the week, but turned around to form a hammer. A hammer of course is a bullish sign and thus I think that we will eventually continue to go higher. If we can break above the top of a hammer, I think that the market will reach towards the 2300 level, and further than that. Pullbacks continue to offer buying opportunities, in a market that I believe will continue to show US strength in the stock markets. Selling isn’t even a thought at this point.
Chris is a proprietary trader with more than 20 years of experience across various markets, including currencies, indices and commodities. As a senior analyst at FXEmpire since the website’s early days, he offers readers advanced market perspectives to navigate today’s financial landscape with confidence.