


The S&P 500 went back and forth during the week, testing the 2400 level underneath. That’s an area that was previously resistive, and the area below should be supportive. The fact that we bounced from this level suggests that there is a hammer. A break above the top of the hammer, the 2450 handle, the market should then go towards the 2500 level. The market is in an uptrend, and even though we have seen a significant amount of volatility, it looks as if the buyers are still in control.
Advertisement
Advertisement
S&P 500 Forecast for the Week of July 3, 2017, Technical Analysis
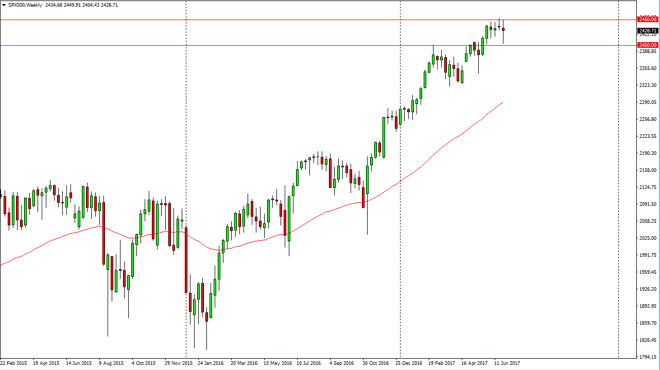
The S&P 500 went back and forth during the week, testing the 2400 level underneath. That’s an area that was previously resistive, and the area below
Loading
About the Author
Christopher LewisSenior Analyst
Chris is a proprietary trader with more than 20 years of experience across various markets, including currencies, indices and commodities. As a senior analyst at FXEmpire since the website’s early days, he offers readers advanced market perspectives to navigate today’s financial landscape with confidence.
Latest news and analysis
- Loading
Advertisement
Loading
Advertisement
Advertisement
Advertisement