The S&P 500 gapped higher at the open of the week, and then shot towards the 2400 level. However, we turned around to form a less impressive candle,
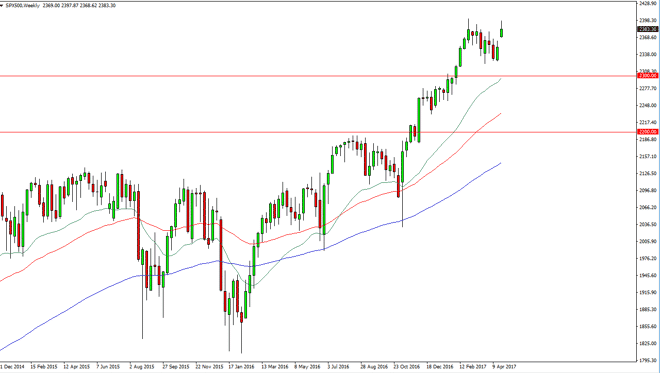
The S&P 500 gapped higher at the open of the week, and then shot towards the 2400 level. However, we turned around to form a less impressive candle, but I believe that any pull back from here will find buyers to continue the longer-term uptrend. I have no interest in shorting the S&P 500, it has been bullish for a very long time, and I think that should continue to be the case, reaching towards the 2500 level. The 2300 level below should continue to be the absolute floor in this market.
Chris is a proprietary trader with more than 20 years of experience across various markets, including currencies, indices and commodities. As a senior analyst at FXEmpire since the website’s early days, he offers readers advanced market perspectives to navigate today’s financial landscape with confidence.