The S&P 500 rallied a bit during the week, slamming into the 2500 level. If we can break above that level, the market should continue to go much
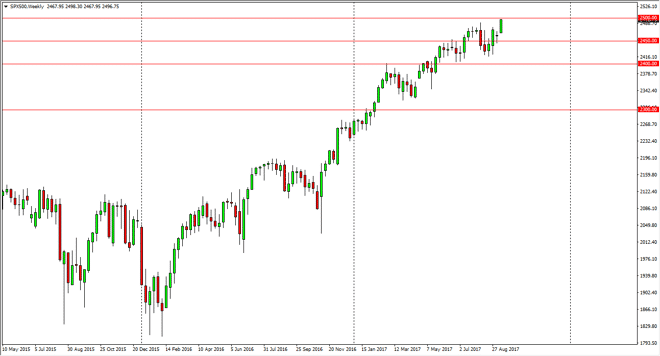
The S&P 500 rallied a bit during the week, slamming into the 2500 level. If we can break above that level, the market should continue to go much higher, perhaps turning into a “buy-and-hold” situation. Alternately, if we pull back from here, I would expect to see plenty of support near the 2450 level. Ultimately, I have no interest in shorting the S&P 500 as it looks so bullish. Given enough time, I do think that we eventually break out. Longer-term, I would have a target for 2600.
Chris is a proprietary trader with more than 20 years of experience across various markets, including currencies, indices and commodities. As a senior analyst at FXEmpire since the website’s early days, he offers readers advanced market perspectives to navigate today’s financial landscape with confidence.