
Advertisement
Advertisement
S&P 500 Futures forecast for the week of December 31, 2012, Technical Analysis
Updated: Aug 21, 2015, 02:00 GMT+00:00
The S&P 500 futures fell for the week but remained above the 1400 level in order to respect the consolidation range that we have been over the last
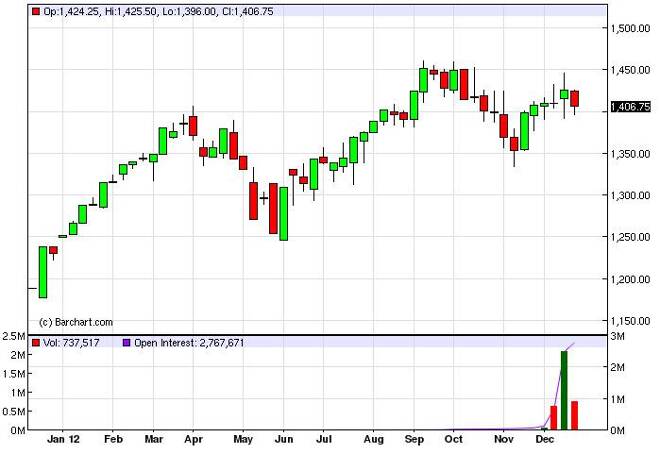
The S&P 500 futures fell for the week but remained above the 1400 level in order to respect the consolidation range that we have been over the last couple of weeks. With the low liquidity this time here, it really is in a surprise to see this market struggling to make any significant moves. However, there are also mitigating factors involving Congress. After all, they are still discussing the so-called “fiscal cliff”, and this can most certainly move the markets as well.
In this type of environment it is very difficult to trade at times when you have problems that involve so many different moving parts like the debt crisis in the United States. Looking this chart however, we can see that the 1450 level has been a bit of a ceiling lately, and it would take a move above that level for us to start buying on a longer-term basis. Alternately, we can also see that the 1400 level is significant support, and if we break down below that the next real long-term challenge comes in 1350. A move below 1350 has this market completely broken, and we draw another 100 points in relatively short order.
Because of this, this is one of the more interesting charts we follow right now, and as a result there should be quite a bit of volatility coming. However, until we get the main thrust of traders coming back into the marketplace, this market will be relatively thin and possibly calm. On the other side of that coin however, when you get shock headlines out like we could from the U.S. Congress, the lack of liquidity could push this pair much farther than usual.
Looking at the shape of this chart though, if we managed to move lower it would signal that we have just made a lower high and this of course is a beginning sign of a trend change on the chart. With that being said, we are actually more comfortable selling until we break above the 1450 level when it would be most obvious that the bull market continues.
About the Author
Christopher Lewisauthor
Chris is a proprietary trader with more than 20 years of experience across various markets, including currencies, indices and commodities. As a senior analyst at FXEmpire since the website’s early days, he offers readers advanced market perspectives to navigate today’s financial landscape with confidence.


Advertisement