The S&P 500 went sideways initially during the day on Thursday, but then fell to the vital 2450 handle. If we can hold this area, it’s likely that the
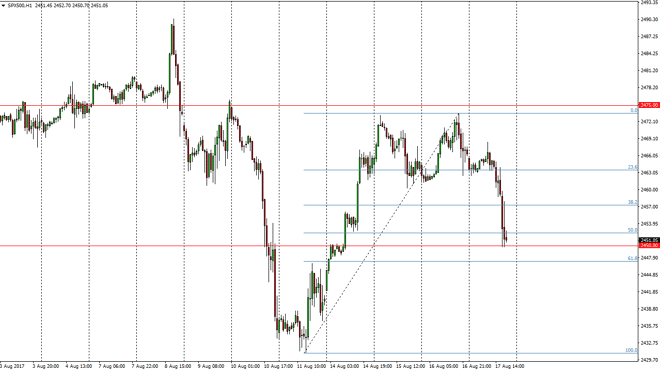
The S&P 500 went sideways initially during the day on Thursday, but then fell to the vital 2450 handle. If we can hold this area, it’s likely that the market should continue to go higher. If we bounce from here, it’s likely that we will continue to rally again. However, if we break down below the 2440 level, I think the market probably goes down to the 2425 level or so. Ultimately, this is a very volatile market, and quite frankly I think that we will continue to see a lot of noise. I believe that the uptrend is still intact if we can stay above the vital 2400 level underneath. We are a long way from there, so I’m not overly concerned, but I do recognize that we may need to cool offer a little while.
Chris is a proprietary trader with more than 20 years of experience across various markets, including currencies, indices and commodities. As a senior analyst at FXEmpire since the website’s early days, he offers readers advanced market perspectives to navigate today’s financial landscape with confidence.