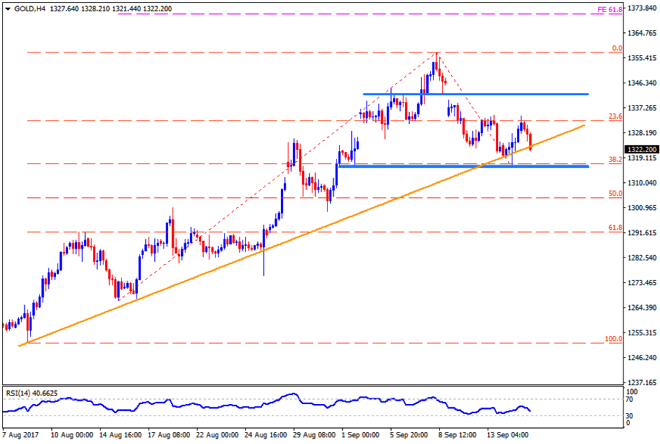
GOLD With its repeated failures to clear $1334-35 immediate resistance, the Gold prices are presently testing five-week old ascending trend-line, at
With its repeated failures to clear $1334-35 immediate resistance, the Gold prices are presently testing five-week old ascending trend-line, at $1323, breaking which it can drop to $1315-16 horizontal-line. Given the yellow metal’s additional downturn after $1315, the $1300, the $1294 & the $1290 could entertain sellers prior to offering them the $1285-81 multiple support-zone. Alternatively, a clear break of $1335 could propel the precious-metal towards $1343, which if broken may further accelerate its up-moves to the $1347, the $1351 and the $1358 resistance-levels. In case if the quote continue rising beyond $1358, the 61.8% FE level of $1371.50 could appear on the chart.
Alike Gold, the Silver is also testing nearby support-line; though, a horizontal one around $17.65-66, which if broken can fetch the white-metal to a month-long ascending trend-line support of $17.35. During the bullion’s additional weakness below $17.35, the $17.20 and the $17.00 could mark their presence while $16.80 and the $16.55 may appear on seller’s radar then after. Meanwhile, a downward slanting TL, at $17.80 now, limits the metal’s near-term advance, breaking which $18.00, the $18.10 and the $18.25 may become live. Further, 61.8% FE level of $18.55 seems to be the Buyers’ next target if the successfully conquer the $18.25 number.
Even after failing to clear the $50.30-45 horizontal-line, the Crude still trades above 200-day SMA and indicates brighter chances to surpass the $50.45, which in-turn could open the door for its north-run to $51.00 and the $51.70. If the energy quote manages to sustain its trading above $51.70, the $52.50 and the $53.30 could be considered as good resistances to watch. On the downside, a daily close below 200-day SMA level of $49.25 can drag the prices to the $48.70, the $48.25 and the $47.20 supports. Though, nearly three-month old ascending trend-line, at $46.50, may confine its follow-on downside, which if neglected could magnify the Crude weakness by flashing $45.50 and the $45.00 rest-figures.
Cheers and Safe Trading,
Anil Panchal
An MBA (Finance) degree holder with more than five years of experience in tracking the global Forex market. His expertise lies in fundamental analysis but he does not give up on technical aspects in order to identify profitable trade opportunities.