
Advertisement
Advertisement
Technical Outlook – EURUSD, GBPUSD, NZDUSD and USDJPY
By:
EURUSD While short-term descending trend-line resistance, coupled with the 50-day SMA, seems restricting near-term up-move by the EURUSD, signaling
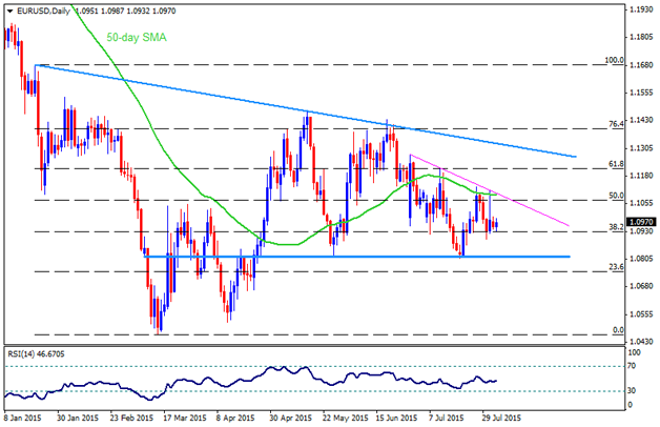
EURUSD
While short-term descending trend-line resistance, coupled with the 50-day SMA, seems restricting near-term up-move by the EURUSD, signaling extended declines, the 1.0820 – 1.0800 horizontal region becomes strong downside support, with 1.0920, 38.2% Fibo, being intermediate rest. However, recent trading pattern, coupled with important releases favoring USD strength, could weaken the pair towards breaking 1.0800 support, targeting towards 1.0700 and 1.0630 supports while sustained close below 1.0630 can make the pair vulnerable to challenge March lows, near 1.0460. Alternatively, a break above 1.1100 round figure mark, including the mentioned trend-line and SMA, could trigger the pair’s up-move towards 61.8% Fibo, near 1.1200 mark, prior to testing nearly seven month old descending trend-line resistance, near 1.1330. Even if the break of 1.1330 is less likely, such a break can strengthen the pair’s upward trajectory to surpass 1.1500 region.
GBPUSD
With the horizontal resistance, coupled with symmetrical triangle resistance-line, 1.5660-70 area, restricting the pair’s near-term advance, GBPUSD also witnesses strong downside support near 1.5560-50 region, including support-line of the formation and 50-day SMA. Though, recent higher highs favor GBPUSD up-move towards 1.5800 area, on the break of 1.5670 while a sustained break of 1.5800 signals the pair’s extended up-ward trajectory towards 1.5930 and the 1.6000 resistances. However, a break below 1.5550 can quickly pullback the pair towards 1.5460-50 support-zone, breaking which 38.2% Fibo, near 1.5400 – 1.5390 can become intermediate rest for the pair prior to its plunge to 50% Fibo, near 1.5250 level. Should the pair successfully breaks the 1.5250 on a closing basis, it can slip below 1.5100 mark.
NZDUSD
Even if the 0.6500 area provides strong downside support to restrict near-term NZDUSD decline, more than a three month old descending trend-line resistance, coupled with inability to break 0.6730-50 horizontal mark, favors the extended downturn by the pair. The pair currently witnesses 0.6630, descending trend-line, as an immediate resistance, breaking which 0.6750 can’t be denied while a close above 0.6750 is likely to test 50-day SMA, presently near 0.6830. Given the pair’s ability to surpass 0.6830 on a closing basis, it can quickly rise to 0.6950 and the 0.7080 resistances. On the downside, a break below 0.6500 can make the pair vulnerable to plunge towards 0.6350 and 0.6280 support levels with 61.8% FE level, near 0.6420, being intermediate rest.
USDJPY
USDJPY again failed to break 124.40-50 resistance area, signaling 123.00 re-test; however, 50-day SMA and the 23.6% Fibo, near 123.50, can provide immediate downside support to the pair. Should it extends the decline below 123 mark, the 122.50 and the 121.70-80 region is likely important supports prior to the pair’s plunge to 120.80 mark. On the upside, a break of 124.50 can quickly target 125.00 round figure mark prior to challenging the 125.85 high. Should the pair enables itself to break 125.85, the 61.8% FE, near 126.80 is likely next resistance for the pair before it could target 128 region.
Follow me on twitter to discuss latest markets events @Fx_Anil
About the Author
Anil Panchalauthor
An MBA (Finance) degree holder with more than five years of experience in tracking the global Forex market. His expertise lies in fundamental analysis but he does not give up on technical aspects in order to identify profitable trade opportunities.


Advertisement