
Advertisement
Advertisement
Technical Outlook: Gold, Silver And WTI Crude Oil
By:
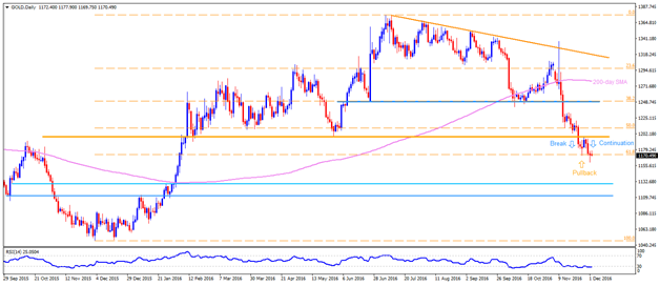
GOLD Considering the Gold’s Break-Pullback-Continuation pattern around $1197 - $1200 horizontal-line, the yellow metal is more likely to extend its
GOLD
Considering the Gold’s Break-Pullback-Continuation pattern around $1197 – $1200 horizontal-line, the yellow metal is more likely to extend its south-run towards $1128 & $1110 supports. Though, $1163, $1151 & $1144 may offer intermediate halts to bullion prices during its sustained weakness. In case if prices reverse from present levels, $1197 – $1200 continue acting as strong barrier, which if broken can trigger the metal’s uptick to $1218 & $1232-33 resistance figures. Should there be additional strength on the part of the bullion after breaking $1233, 38.2% Fibonacci Retracement of its December 2015 – July 2016 upside, around $1248-50, becomes important to observe, which if broken enables it to aim for $1260 & 200-day SMA level of $1279.
Silver
Alike Gold, Silver prices are also expected to continue trading down; however, its expected halt is nearer, around $15.95-90, breaking which it could further drop to $15.50, $15.15 and the $14.65 support-levels. Given the white-metal dip below $14.65, it becomes vulnerable to re-test December 2015 lows of $13.65. On the upside, $16.75 and the $17.15 are likely nearby resistances to curb metal’s immediate U-turn, which if cleared may confront with 50% Fibonacci Retracement of its December 2015 – July 2016 upside, at $17.40. If Bulls govern the price-move beyond $17.40, 200-day SMA level of $17.70 & the $18.00 may entertain buyers.
WTI CRUDE OIL
Even if the OPEC deal and the successful reversal from 200-day SMA signals further upside of the Crude, $51.85 – $52.15 becomes an important resistance region for energy traders to observe which may trigger profit-booking in prices. Presently, the quote is likely declining towards $49.40, breaking which $48.50 & $47.80 may offer following rests. Should the energy-vehicle decline below $47.80, 23.6% Fibonacci Retracement of its January – June upside, at $46.30 and the 200-day SMA level of $45.10 become crucial to watch. Meanwhile, $51.30 acts as adjacent resistance for prices before they confront previous mentioned resistance region around $51.85 – $52.15, which if broken can fuel the quote to 61.8% FE mark of $54.00 and then to $55.00. During the Crude’s extended north-run beyond $55.00, it becomes capable enough to print $56.60-70 and the $58.00 on the chart.
Cheers and Safe Trading,
Anil Panchal
About the Author
Anil Panchalauthor
An MBA (Finance) degree holder with more than five years of experience in tracking the global Forex market. His expertise lies in fundamental analysis but he does not give up on technical aspects in order to identify profitable trade opportunities.


Advertisement