The crypto winter has left the crypto top ten in the deep red. Three look attractive at current price levels when considering their individual attributes.
It has been a bearish eight months for bitcoin and the broader crypto market. In late 2021, the threat of a material shift in the regulatory landscape weighed on cryptocurrencies.
Governments globally and even the International Monetary Fund (IMF) called for a global regulatory framework.
This year, inflation, the fear of a recession, and a hawkish Fed added further downside pressure.
To make matters worse, the market experienced its first top ten cryptocurrency collapse. The TerraUSD (UST) and Terra LUNA meltdowns led to more calls for greater regulatory oversight.
Since a November all-time high of $3,009 billion, the total crypto market cap tumbled to a May low of $1,082 billion before steadying. With the total market cap still down by $1,809 billion, opportunities are there for investors able to withstand the pressures of crypto trading.
We have chosen three cryptocurrencies for 2022.
These are bitcoin (BTC), Binance Coin (BNB), and Solana (SOL).
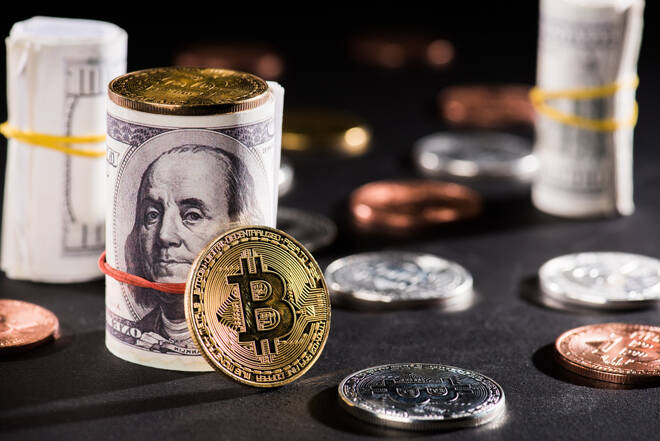
Bitcoin is the largest cryptocurrency by market cap and draws interest from retail and institutional investors. Significantly, bitcoin is not only the bellwether of the crypto market but also the most stable, supported by a loyal investor base commonly referred to as bitcoin whales.
Since hitting a November 10 all-time high of $68,979, bitcoin tumbled by 62.5% to a current year low of $25,836 before finding support. Year to date, bitcoin was down 21% to $29,680.
With bitcoin adoption gaining traction in multiple jurisdictions, bitcoin remains the target cryptocurrency for both seasoned and novice investors.
The technical indicators remain bearish for now.
Looking at the EMAs and the 4-hourly candlestick chart (below), it is a bearish signal. Bitcoin sits below the 50-day EMA, currently at $30,092. The 50-day pulled back from the 100-day EMA. The 100-day EMA held steady against the 200-day EMA, BTC neutral.
A move through the 100-day EMA, currently at $30,301, and a bullish cross of the 50-day EMA through the 100-day EMA would signal a shift in sentiment.
The daily candlestick chart affirms the current bearish trend.
Bitcoin sits below the 50-day EMA, currently at $33,303. The 50-day EMA pulled back from the 100-day EMA, with the 100-day EMA falling back from the 200-day EMA; bitcoin negative.
A move through the 100-day EMA, currently at $36,660, could signal the end of the crypto winter and a return to $50,000.
Binance Coin is a top-five crypto, with a market cap of $48.8 billion, and is the native crypto of crypto exchange Binance.
The world’s leading crypto exchange is in expansion mode at a time when other platforms are freezing or reducing headcounts.
Recently, Binance has obtained regulatory approval to offer its services in France, Italy, Dubai, Abu Dhabi, and Bahrain. With trading volumes that dwarf its competitors, the exchange and its native token will likely come out of the crypto winter stronger.
One other attractive feature of Binance is BinanceChain, a community-driven, open-sourced, and decentralized ecosystem. Binance Coin is the governance token.
BNB presents a value proposition for investors. Since a November 10 all-time high of $693.73, BNB slumped by 70% to a May 12 current-year low of $206.62.
Year-to-date, BNB was down 42% to $298.18 on June 3.
The technical indicators are bearish.
Looking at the EMAs and the 4-hourly candlestick chart (below), it is a bearish signal. BNB sits below the 50-day EMA, currently at $307. The 50-day pulled back from the 100-day EMA. The 100-day EMA eased back from the 200-day EMA; BNB negative.
A move through the 100-day EMA, currently at $311, and a bullish cross of the 50-day EMA through the 100-day EMA would signal a shift in sentiment.
The daily candlestick chart affirms the current bearish trend.
Binance Coin sits below the 50-day EMA, currently at $338. The 50-day EMA pulled back from the 100-day EMA, with the 100-day EMA falling back from the 200-day EMA; BNB negative.
A move through the 100-day EMA, currently at $368 could signal a near-term bearish trend reversal and a return to $400.
Solana is a top ten crypto by market cap, currently ranked ninth on CoinMarketCap, with a market cap of $12.78 billion.
SOL is the only Web3 in the top 3 though there are other contenders, including Decentraland (MANA) and The Sandbox (SAND).
Low transaction fees and its established presence within the Web3 space make SOL a viable alternative to Ethereum (ETH). In addition, an ecosystem with plenty of new projects and demand from DeFi investors add to the allure of SOL.
As with the case of the previous two cryptos, Solana has seen heavy losses since peaking in 2021.
From a November 6 all-time high of $259.95, Solana tumbled 86% to a Jun 4 current-year low of $35.72.
Year-to-date, Solana was down 78% to $38.23 on June 3.
The technical indicators remain bearish for now.
Looking at the EMAs and the 4-hourly candlestick chart (below), it is a bearish signal. SOL sits below the 50-day EMA, currently at $42. The 50-day pulled back from the 100-day EMA. The 100-day EMA eased back from the 200-day EMA; SOL negative.
A move through the 100-day EMA, currently at $47, and a bullish cross of the 50-day EMA through the 100-day EMA would signal a shift in sentiment.
The daily candlestick chart affirms the current bearish trend.
Solana sits below the 50-day EMA, currently at $65. The 50-day EMA pulled back from the 100-day EMA, with the 100-day EMA falling back from the 200-day EMA; SOL negative.
A move through the 100-day EMA, currently at $82, could signal a near-term bearish trend reversal and a return to $100.
With over 28 years of experience in the financial industry, Bob has worked with various global rating agencies and multinational banks. Currently he is covering currencies, commodities, alternative asset classes and global equities, focusing mostly on European and Asian markets.