



U.S. Dollar Moves Lower As Oil Prices Fall
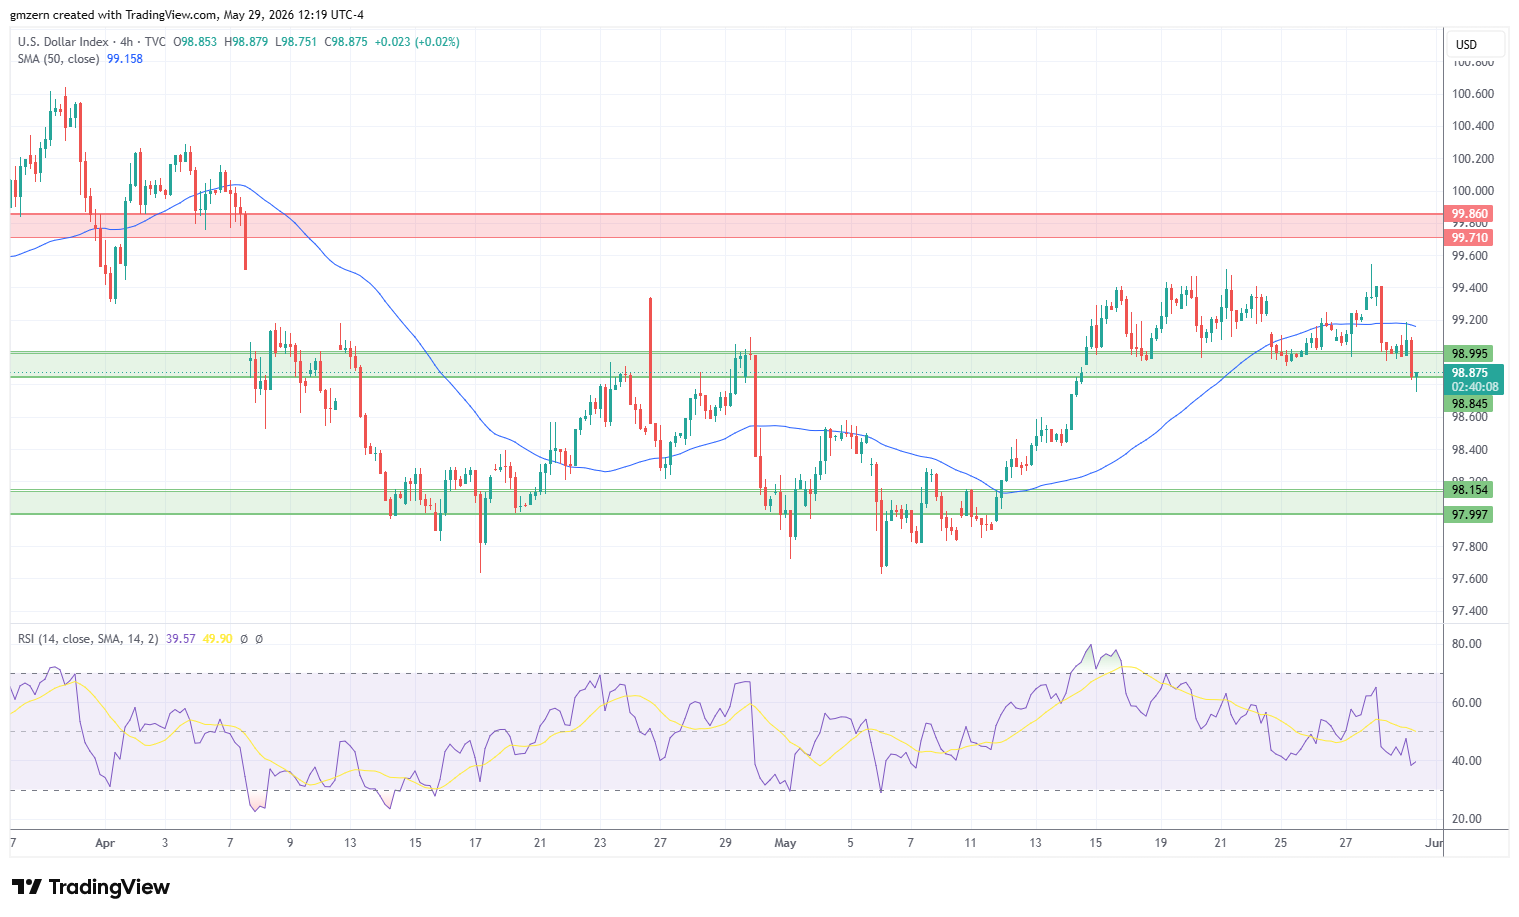
U.S. Dollar Index is losing ground as traders focus on the strong sell-off in the oil markets, which was triggered by Trump’s comments on Iran. Trump said that the he would be meeting in the Situation Room to make a final determination on the potential deal.
Falling oil prices reduced demand for safe-haven assets, which was bearish for the American currency.
Currently, U.S. Dollar Index is trying to settle below the support at 98.85 – 99.00. In case this attempt is successful, U.S. Dollar Index will head towards the next support level, which is located in the 98.00 – 98.15.
EUR/USD Gains Ground As Germany’s Inflation Rate Falls To 2.6%
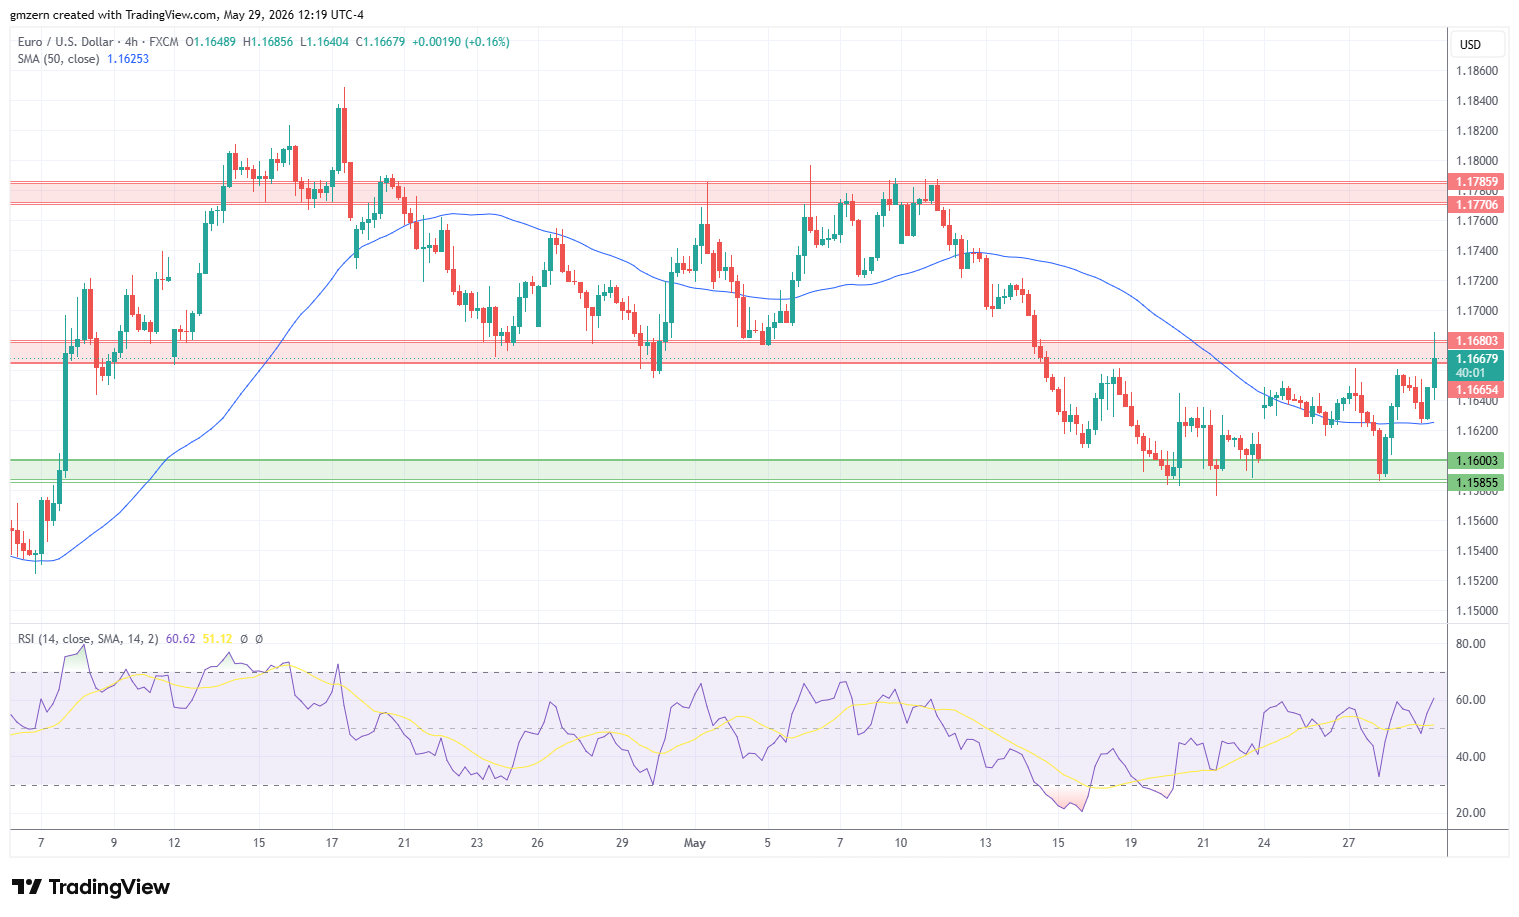
EUR/USD is moving higher as traders focused on Germany’s Inflation Rate report. The report indicated that Inflation Rate declined from 2.9% in April to 2.6% in May, compared to analyst forecast of 2.9%.
Traders also had a chance to take a look at Germany’s Unemployment Rate report. The report showed that Unemployment Rate declined from 6.4% in April to 6.3% in May, while analysts expected that it would remain unchanged at 6.4%.
EUR/USD attempts to settle above the resistance level at 1.1665 – 1.1680. If EUR/USD manages to settle above the 1.1680 level, it will move towards the next resistance, which is located in the 1.1720 – 1.1785 range.
GBP/USD Tests New Highs As Rebound Continues
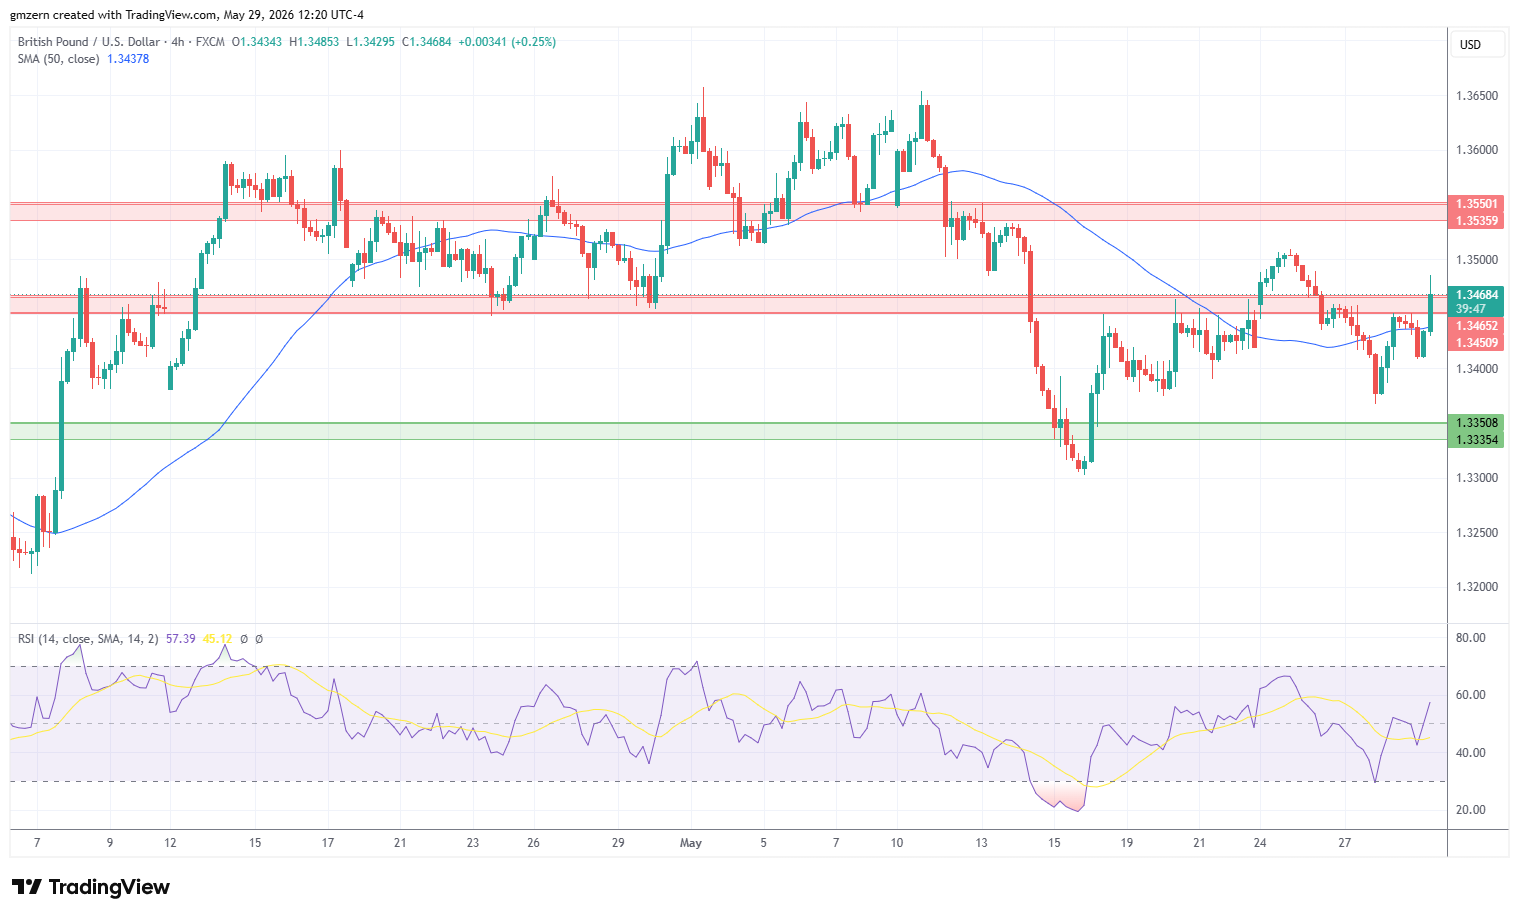
GBP/USD is moving higher amid rising demand for risk assets. Traders bet that U.S. and Iran will reach a deal soon, which may put additional pressure on the American currency.
EUR/USD Price Forecast
Every new EUR/USD analysis as it publishes, today's technical signal and key levels, live price — on one page.
See all EUR/USD forecastsFrom the technical point of view, GBP/USD continues its attempts to settle above the resistance level at 1.3450 – 1.3465. If GBP/USD climbs above the 1.3465 level, it will head towards the next resistance at 1.3535 – 1.3550. RSI remains in the moderate territory, so there is plenty of room to gain additional momentum in case the right catalysts emerge.
USD/CAD Remains Stuck Near 1.3800
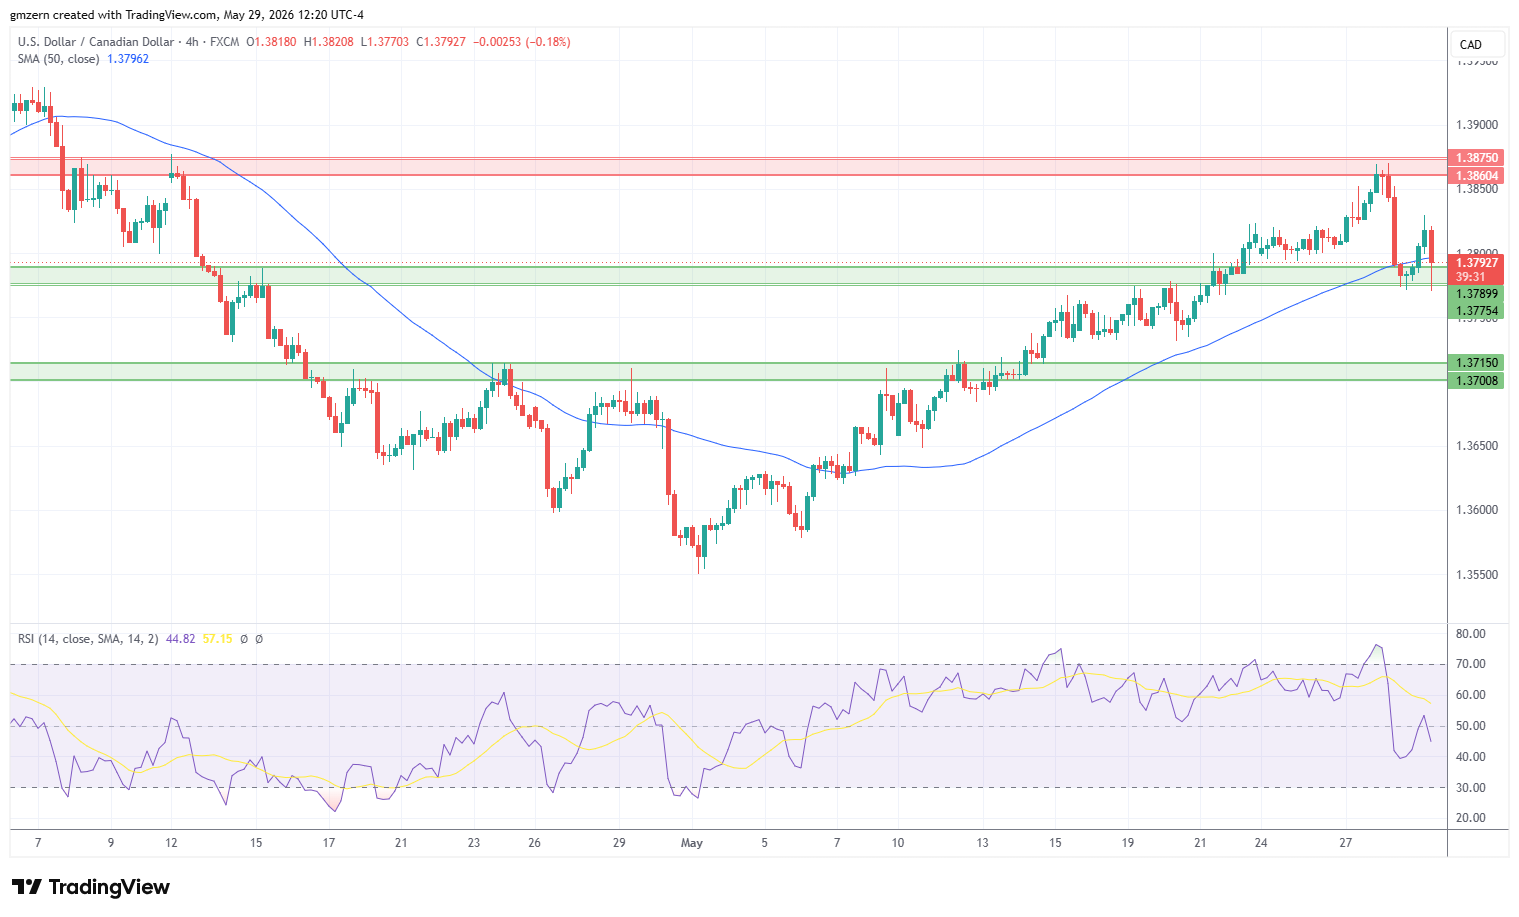
USD/CAD is swinging between gains and losses as traders focus on commodity markets and react to Canada’s GDP report. The report indicated that GDP increased by +0.4% month-over-month in April, compared to analyst forecast of -0.1%. Other commodity-related currencies gained strong upside momentum in today’s trading session.
USD/CAD is trying to settle back below the support at 1.3775 – 1.3790. In case this attempt is successful, USD/CAD will head towards the next support level, which is located in the 1.3700 – 1.3715.
USD/JPY Is Flat As Traders Ignore The Pullback In Treasury Yields
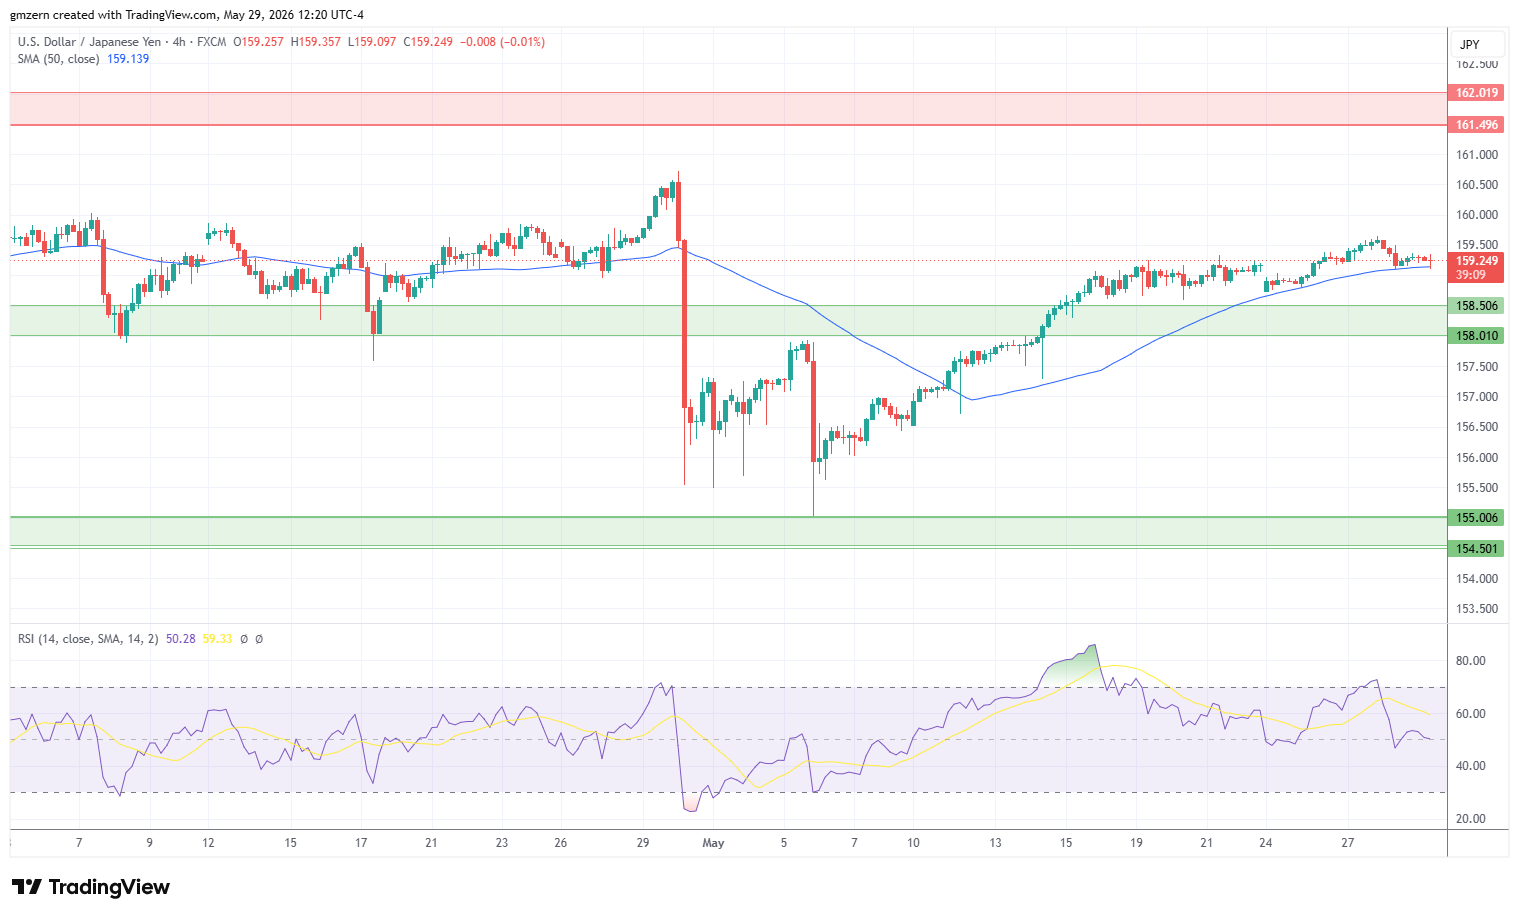
USD/JPY is mostly flat despite the pullback in Treasury yields. The yield of 2-year Treasuries pulled back below the psychologically important 4.00% level, while the yield of 10-year Treasuries declined below 4.45%. Bond traders focus on falling oil prices and bet that inflation pressure would ease after U.S. strikes a deal with Iran.
In case USD/JPY stays above the 50 MA at 159.14, it will head towards the 159.50 level. A move above 159.50 will open the way to the test of the psychologically important 160.00 level.
On the support side, a move below the 50 MA will open the way to the test of the nearest support at 158.00 – 158.50.
If you’d like to know more about how to trade forex, please visit our educational area.