
Advertisement
Advertisement
US Dollar Index (DX) Futures Technical Analysis – August 21, 2015 Forecast
By:
Rising gold prices and the soaring Euro continued to pressure the September U.S. Dollar index during Friday’s pre-market session. Investors are also
Rising gold prices and the soaring Euro continued to pressure the September U.S. Dollar index during Friday’s pre-market session. Investors are also expressing their belief that the Fed will refrain from an interest rate hike in September.
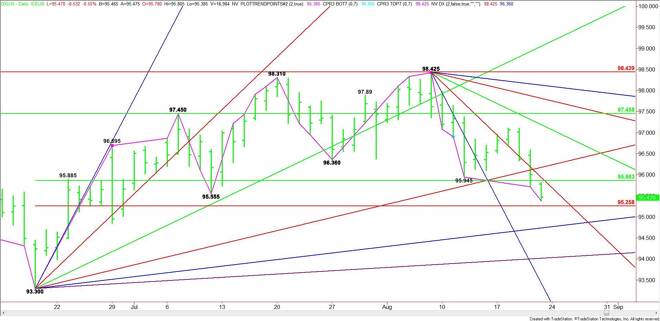
The main trend is down according to the daily swing chart. The main range is 93.30 to 98.425. Its retracement zone at 95.86 to 95.26 is currently being tested. Trader reaction to this zone is likely to determine the direction of the index today and over the near-term.
A sustained move over 95.86 will signal the presence of buyers. Look for an acceleration to the upside if the steep downtrending angle at 95.93 is taken out with conviction. Overcoming the uptrending angle at 96.18 will indicate that the buying is getting stronger.
The daily chart indicates that a sustained move over 96.18 could trigger an acceleration to the upside with the next major target a downtrending angle at 97.18.
The first downside target is a major Fibonacci level at 95.26. Taking out this level with conviction could trigger an acceleration to the downside with the next target coming in at 94.74. This angle is also a trigger point for a further decline into an angle at 94.02. This is the last angle before the 93.30 main bottom.
Simply put, look for a bullish tone to develop on a sustained move over 95.93 and a bearish tone to develop on a sustained move under 95.26.
About the Author
James Hyerczykauthor
James Hyerczyk is a U.S. based seasoned technical analyst and educator with over 40 years of experience in market analysis and trading, specializing in chart patterns and price movement. He is the author of two books on technical analysis and has a background in both futures and stock markets.


Advertisement