The sharp recovery in global equity markets continued to drive the September U.S. Dollar Index futures market higher on Thursday. A resumption of the
The sharp recovery in global equity markets continued to drive the September U.S. Dollar Index futures market higher on Thursday. A resumption of the carry trade helped support the dollar as well as better-than-expected growth in the U.S. economy. The strong GDP figure has triggered a resumption of talk of a possible interest rate hike by the Fed in September. The relative calm in the financial markets after the People’s Bank of China cut rates and its reserve requirements also helped underpin the dollar.
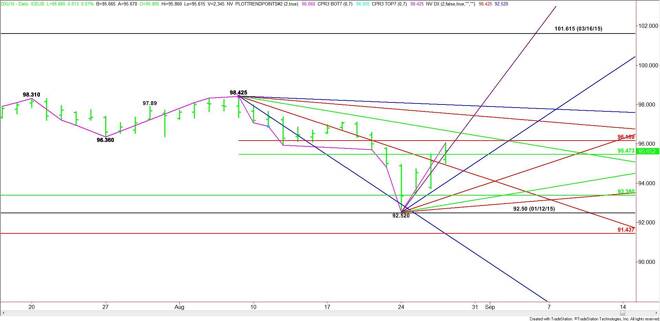
The main trend is down according to the daily swing chart, but the three day rally suggests that momentum has shifted to the upside. The main range is 98.425 to 92.52. The index is currently testing its retracement zone. Trader reaction to this zone will determine the direction of the market today and perhaps over the near-term.
Buyers are going to try to drive the market through this zone and attack the main resistance. Sellers are going to try to form a potentially bearish secondary lower top.
Yesterday’s close at 95.65 makes the first support the 50% level at 95.47. A failure to hold this level will indicate the presence of sellers. Crossing to the weak side of a downtrending angle at 94.68 will signal that the selling is getting stronger. This could trigger a break into an uptrending angle at 94.52.
The angle at 94.52 is also a potential trigger point for a steep break into a loose support cluster at 93.52 to 93.38.
A sustained move over the 50% level at 95.47 will signal the presence of buyers. This could create enough upside momentum to challenge the Fibonacci level at 96.17. The best upside target is a resistance cluster at 96.52 to 96.55.
The resistance cluster at 96.52 to 96.55 is also a trigger point for an upside breakout into the next downtrending angle at 97.49.
Watch the price action and read the order flow at 95.47. This will tell us whether the bulls or the bears are in control.
James Hyerczyk is a U.S. based seasoned technical analyst and educator with over 40 years of experience in market analysis and trading, specializing in chart patterns and price movement. He is the author of two books on technical analysis and has a background in both futures and stock markets.