
Advertisement
Advertisement
US Dollar Index (DX) Futures Technical Analysis – August 31, 2015 Forecast
By:
September U.S. Dollar Index futures continued to benefit from the fresh stimulus from China initiated early last week and the strong recovery in the U.S.
September U.S. Dollar Index futures continued to benefit from the fresh stimulus from China initiated early last week and the strong recovery in the U.S. equity markets. The main trend is still down on the daily swing chart, but momentum has shifted to the upside. The market is in a position to continue the rally if it could take out a Fibonacci level with conviction.
Comments over the week-end from Fed Vice Chair Stanley Fischer could generate some upside momentum. Fischer told CNBC on Friday and a crowd at the Jackson Hole symposium on Saturday that the Fed is on-track for an interest rate hike in 2015. He added that the central bank is aware of the volatility in the market, however, the Fed is primarily focused on the labor market and inflation.
This puts increased emphasis on Friday’s U.S. Non-Farm Payrolls report. If it comes out stronger-than-expected then the timeline for a rate hike could be moved up to September. This could create increased volatility leading up to the mid-September FOMC meeting.
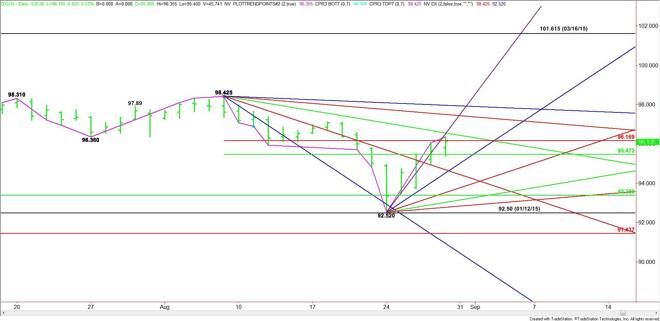
Technically, the main trend is down according to the daily swing chart. The short-term range is 98.425 to 92.52. Its retracement zone at 95.47 to 96.17 is currently being tested. Trader reaction to the Fib level at 96.17 is likely to set the tone for the day.
A sustained move over 96.17 should lead to a quick test of a downtrending angle at 96.43. The daily chart opens up to the upside over 96.43 with the next two targets coming in at 97.43 and 98.39. The latter is the last potential resistance angle before the 98.425 main top.
A failure at 96.17 will signal the presence of sellers. The first target is the 50% level at 95.47. The daily chart opens up to the downside under this level with the next target a steep uptrending angle at 95.02.
Breaking 95.02 could trigger a move into a downtrending angle at 94.43. Crossing to the weak side of this angle will put the dollar index in an extremely weak position.
Watch the price action and read the order flow at 96.17. This will tell us whether the bulls or the bears are in control. Also watch for volatility to the upside because of Fed Vice Chair Fischer’s hawkish comments.
About the Author
James Hyerczykauthor
James Hyerczyk is a U.S. based seasoned technical analyst and educator with over 40 years of experience in market analysis and trading, specializing in chart patterns and price movement. He is the author of two books on technical analysis and has a background in both futures and stock markets.


Advertisement