
Advertisement
Advertisement
US Dollar Index (DX) Futures Technical Analysis – February 11, 2016 Forecast
By:
March U.S. Dollar Index futures are trad ing lower shortly before the cash market opening. The price action suggests the market believes the Fed is not
March U.S. Dollar Index futures are trad
ing lower shortly before the cash market opening. The price action suggests the market believes the Fed is not going to raise interest rates in 2016.
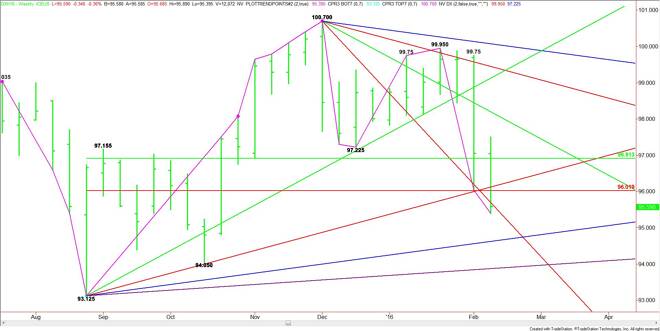
The main trend is down according to the weekly swing chart. The main range is 93.125 to 100.70. Its retracement zone is 96.91 to 96.02. The market is also trading on the weak side of this zone, putting the index in a bearish position.
The key angle to watch on the weekly chart drops in at 95.70 this week. Trading on the weak side of this angle will also put the index in a bearish position. This could trigger an eventual move into the weekly uptrending angle at 94.69.
Looking at the daily chart, the main trend is down and so is the momentum. Today, the market is set to open up under a key downtrending angle at 96.20. Look for the selling pressure to continue as long as the index remains under this angle.
Both the daily and weekly charts indicate the trend is down. The key resistance on the weekly chart comes in at 95.70. The key resistance on the daily chart is 96.20. Look for the trend to continue as long as the market remains under this levels.
There is always the possibility of a short-term closing price reversal bottom. However, if one does not form then we could eventually see a break into the major support on the weekly chart at 94.69.
About the Author
James Hyerczykauthor
James Hyerczyk is a U.S. based seasoned technical analyst and educator with over 40 years of experience in market analysis and trading, specializing in chart patterns and price movement. He is the author of two books on technical analysis and has a background in both futures and stock markets.


Advertisement