
Advertisement
Advertisement
US Dollar Index (DX) Futures Technical Analysis – November 13, 2015 Forecast
By:
December U.S. Dollar Index futures closed lower on Thursday after posting a volatile outside move. The price action was related to a stronger Japanese Yen
December U.S. Dollar Index futures closed lower on Thursday after posting a volatile outside move. The price action was related to a stronger Japanese Yen and Australian Dollar, a volatile two-sided trade by the Euro and some position-squaring ahead of today’s important U.S. retail sales report.
Later today, all eyes will be on the U.S. retail sales report because it will tell the Fed if consumers are helping to strengthen the economy. Month-to-month core retail sales are expected to be up 0.4%. Month-to-month retail sales are expected to show a rise of 0.3%.
Month-to-month PPI is expected to rise 0.2%. Core PPI is expected to be up 0.1%. Preliminary University of Michigan Consumer Sentiment is estimated at 91.3.
Stronger-than-expected retail sales should solidify a rate hike by the Fed in December. This should underpin the U.S. Dollar.
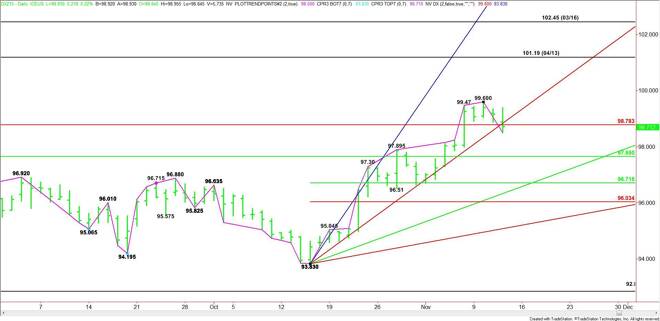
Technically, the main trend is up according to the daily swing chart. However, momentum has shifted to the downside because of the two-day down move and the break under a key Fibonacci level and steep uptrending angle.
Based on the close at 98.71, the key area to watch is the major Fibonacci level at 98.78 and the steep uptrending angle at 99.08.
Overcoming the Fibonacci level will be the first sign of strength, however, don’t expect an acceleration to the upside unless there is a sustained move over 99.08.
The first major upside target is this week’s high at 99.60. Overtaking this level will signal a resumption of the uptrend. It will also make 98.50 a new swing bottom.
A sustained move under 98.78 will indicate the presence of sellers. The daily chart indicates there is room to the downside with the first target a major 50% level at 97.65. This level is also a trigger point for a further break with 96.71 another potential target.
Watch the price action and read the order flow at 99.08. Trader reaction to this uptrending angle will tell us whether the bulls or the bears are in control.
About the Author
James Hyerczykauthor
James Hyerczyk is a U.S. based seasoned technical analyst and educator with over 40 years of experience in market analysis and trading, specializing in chart patterns and price movement. He is the author of two books on technical analysis and has a background in both futures and stock markets.


Advertisement