
Advertisement
Advertisement
US Dollar Index (DX) Futures Technical Analysis – November 25, 2015 Forecast
By:
December U.S. Dollar Index futures sold-off on Tuesday. The catalyst behind the move was tensions between Turkey and Russia. The news that Turkish fighter
December U.S. Dollar Index futures sold-off on Tuesday. The catalyst behind the move was tensions between Turkey and Russia. The news that Turkish fighter jets had shot down a Russian-made warplane near the Syrian border sparked a flight to safety among investors, pressuring the U.S. Dollar.
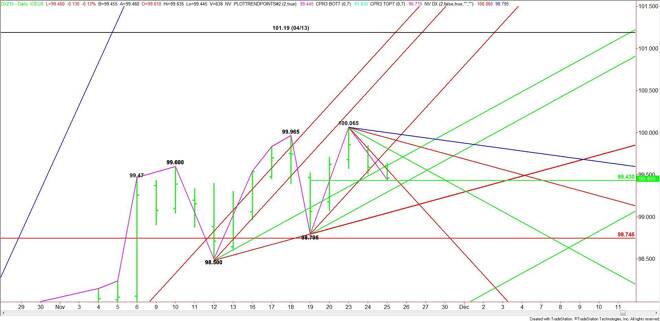
Technically, the main trend is up according to the daily swing chart. Although the series of higher-highs and higher-lows has been impressive, the gains from high-to-high suggest that upside momentum may be slowing.
The short-term range is 98.795 to 100.065. Its 50% level or pivot at 99.43 is controlling the near-term direction of the market. Trader reaction to this level should set the tone for the day.
Currently, the index is trading at 99.43.
A sustained move under 99.43 will signal the presence of sellers. This could trigger a break into an uptrending angle at 99.30. The daily chart opens up under this angle with the next main target a potential support cluster at 99.06 to 99.05.
A sustained move over .9943 will indicate the presence of buyers. The first target is a downtrending angle at 99.57. This is followed by an uptrending angle at 99.63.
The daily chart begins to open up over 99.63 with the next potential target a resistance cluster at 99.80 to 99.82. A breakout over 99.82 could fuel a move into downtrending angles at 99.94 and 100.00. The latter is the last potential resistance angle before the 100.065 main top.
Watch the price action and read the order flow at 99.43 the rest of the session. The market is currently being driven by outside factors so we could see choppy, two-sided trading.
The chart pattern indicates the way of least resistance is to the downside because the potential support levels are spread out. Any rallies are likely to be labored.
About the Author
James Hyerczykauthor
James Hyerczyk is a U.S. based seasoned technical analyst and educator with over 40 years of experience in market analysis and trading, specializing in chart patterns and price movement. He is the author of two books on technical analysis and has a background in both futures and stock markets.


Advertisement