



Dollar Jumps as Sticky Inflation Cuts Rate-Cut Hopes
On May 25, 2026, the greenback rallied following April’s hotter-than-anticipated CPI print, which revived inflation worries and dimmed hopes for imminent rate cuts from the Fed. While the ceasefire reached between the U.S. and Iran has helped bring some normalization to oil flowing through the Strait of Hormuz, April’s data exposed still-higher shelter costs as well as the earlier-year surge in energy costs.
The stronger dollar weighed on the euro, while the ECB offered only mixed policy guidance, and the pound remained cautious as the Bank of England held its data-dependent approach to a mixed bag of UK economic figures and global risk.
In addition to today’s CPI print, though this conditional U.S.-Iran truce has reduced near-term safe-haven flows in the greenback of late, market expectations that the Fed may yet deliver policy easing remain mixed and will continue to react to data in the days ahead.

DXY Holds $99.03, Blue Ascending Channel Still Holding
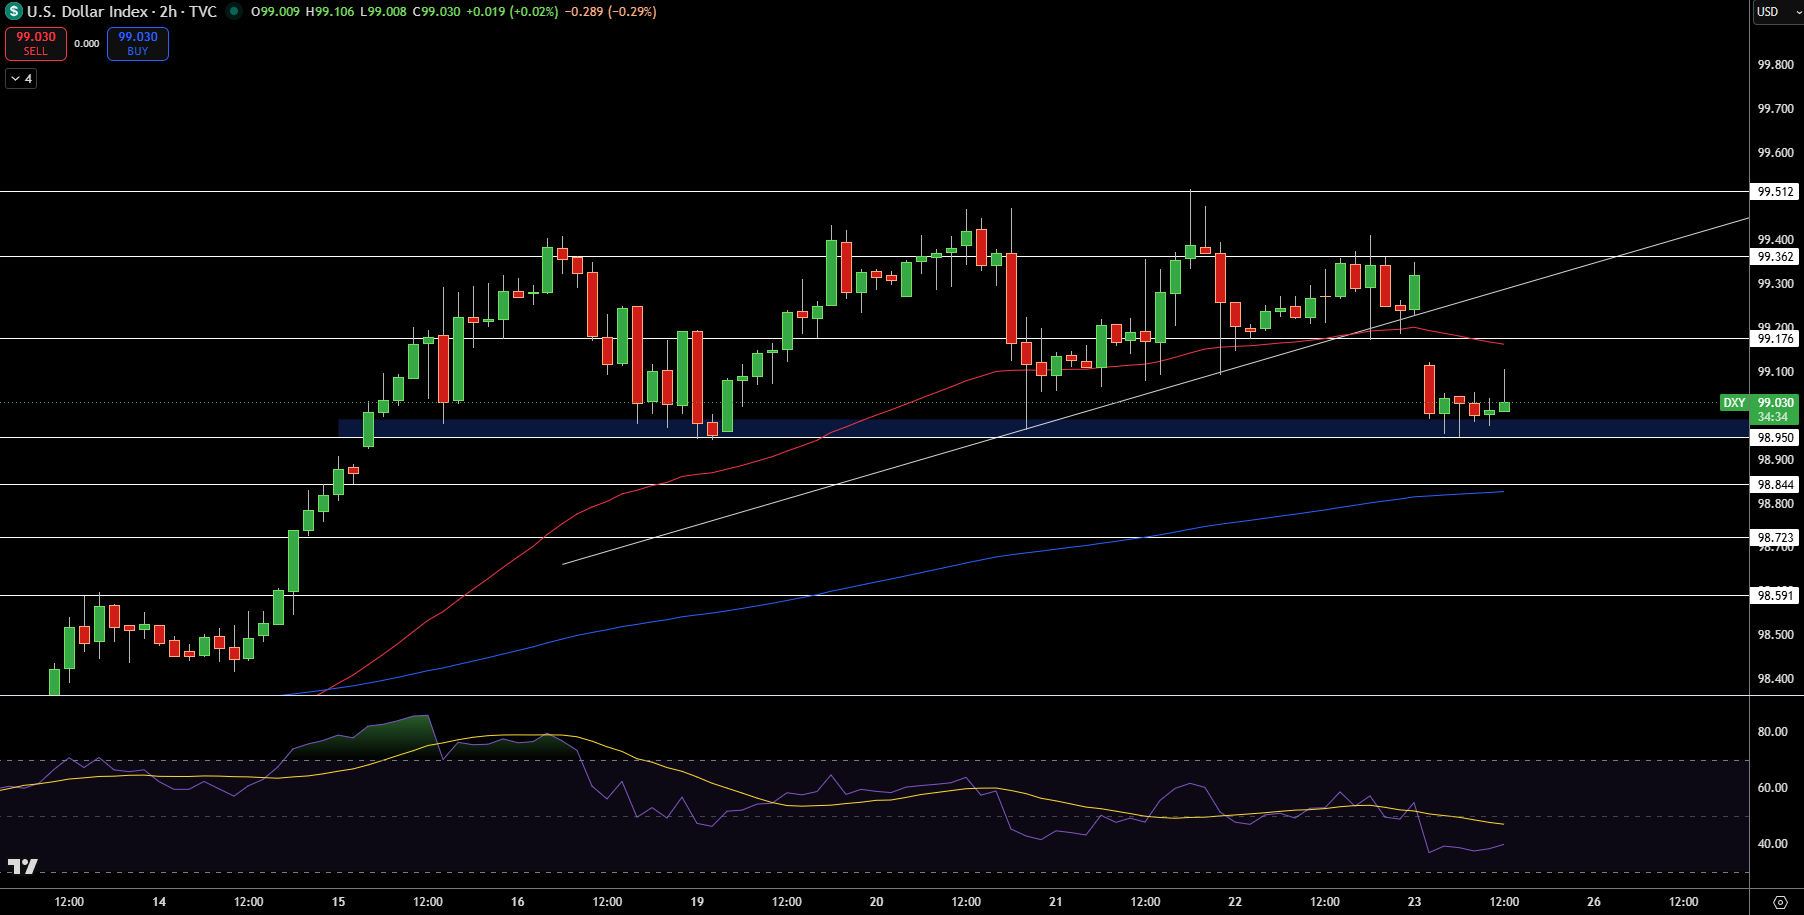
DXY is trading at $99.03 on a 2h candlestick chart as it trades inside the blue ascending channel while the green rejection wicks just held the blue rising trendline at $98.90 and the red 50-period moving average. Price is printing higher lows with bullish green bodies above the $99.00 pivot while the RSI is above 52 indicating that price is recovering momentum but is still below overbought territory.
The white descending trendline from April is rejected again. The most recent Fib retracement level from the May low is $99.17 to $99.36 which is near-term resistance.
The volume profile indicates $98.97 is strong as a dynamic floor with the buyers absorbing supply. Structure is bullish as it continues to trade above $98.97 with the blue breakout rising to the $99.41 to $99.51 range.
Trade Idea: Buy $99.03 to $99.36, Stop $98.80.
GBP/USD Price Forecast
Every new GBP/USD analysis as it publishes, today's technical signal and key levels, live price — on one page.
See all GBP/USD forecastsGBP/USD Protects $1.3485, Rising Channel Still Standing
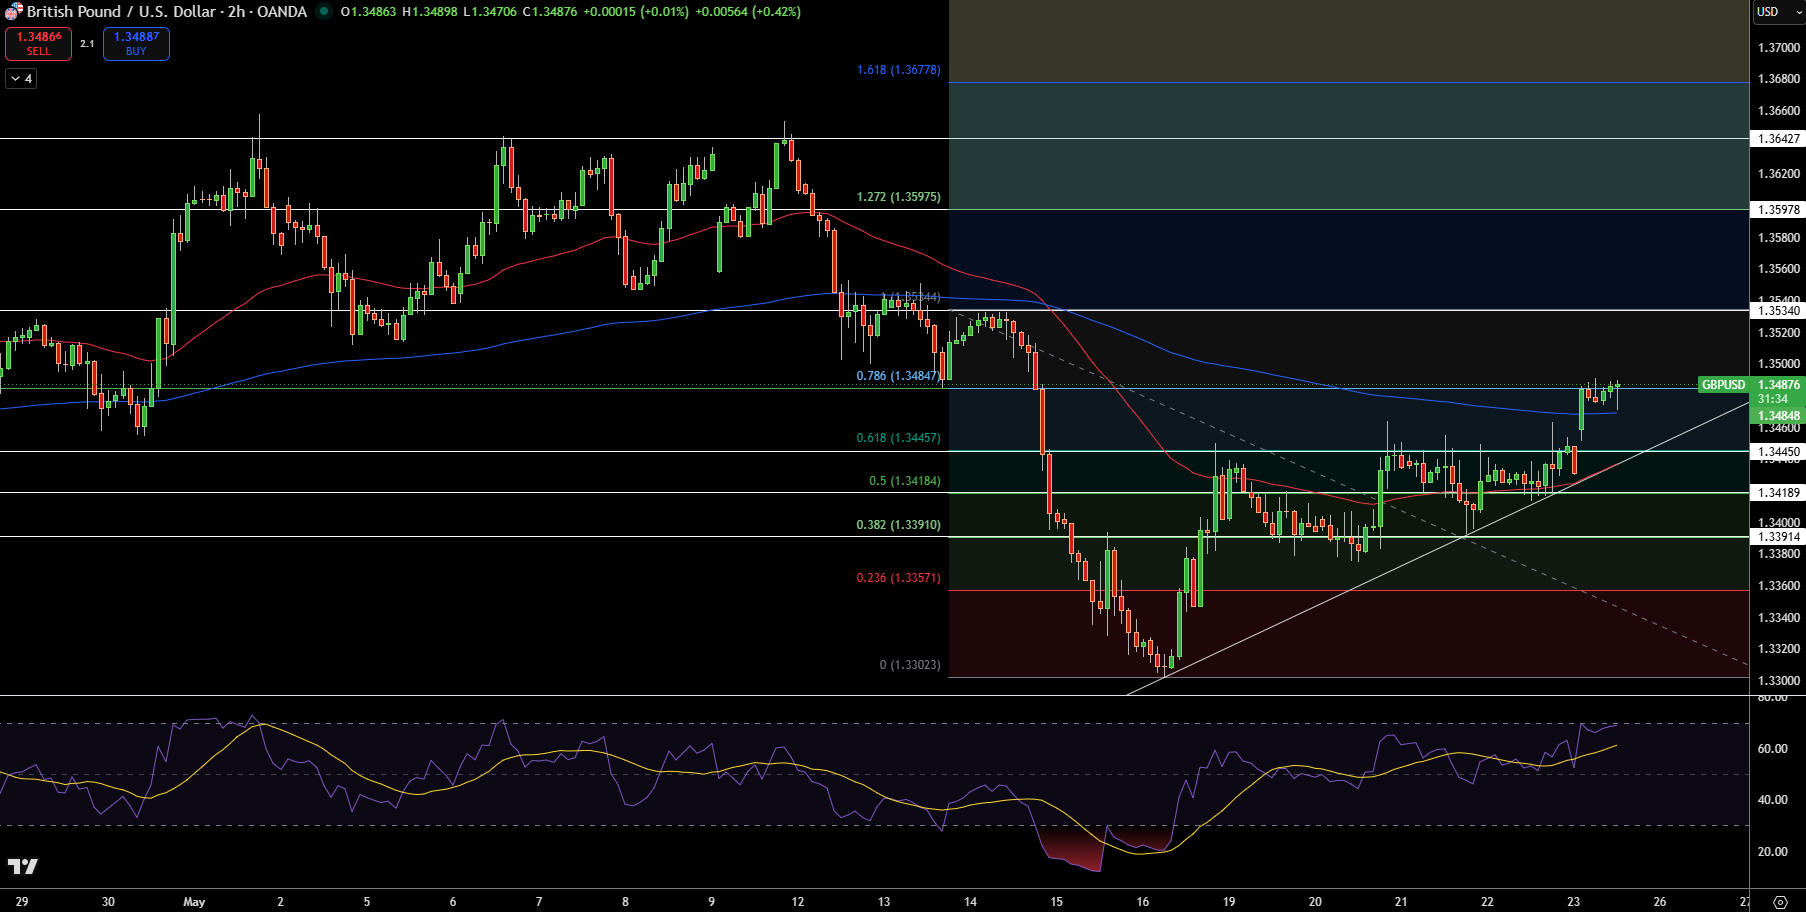
GBP/USD is at $1.3485 in 2h candles as it is above a white rising trendline while just defended a blue rising trendline at $1.339. It just rejected $1.339, which is a 0.382 Fib level, but the red MA near $1.345 acts as dynamic resistance. There are mixed candles with green rejection wicks absorbing supply at $1.339, which is on a volume profile.
The RSI is just under 50 and is in neutral territory. Next resistance at $1.348 to $1.353 cluster. GBP/USD structure is bullish as it is inside the blue rising trendline with price above $1.339 which is just a 0.382 Fib retracement level.
Trade Idea: Buy $1.3485 to $1.353, Stop $1.339.
EUR/USD Rejects $1.164, White Descending Trendline Holds Price Action
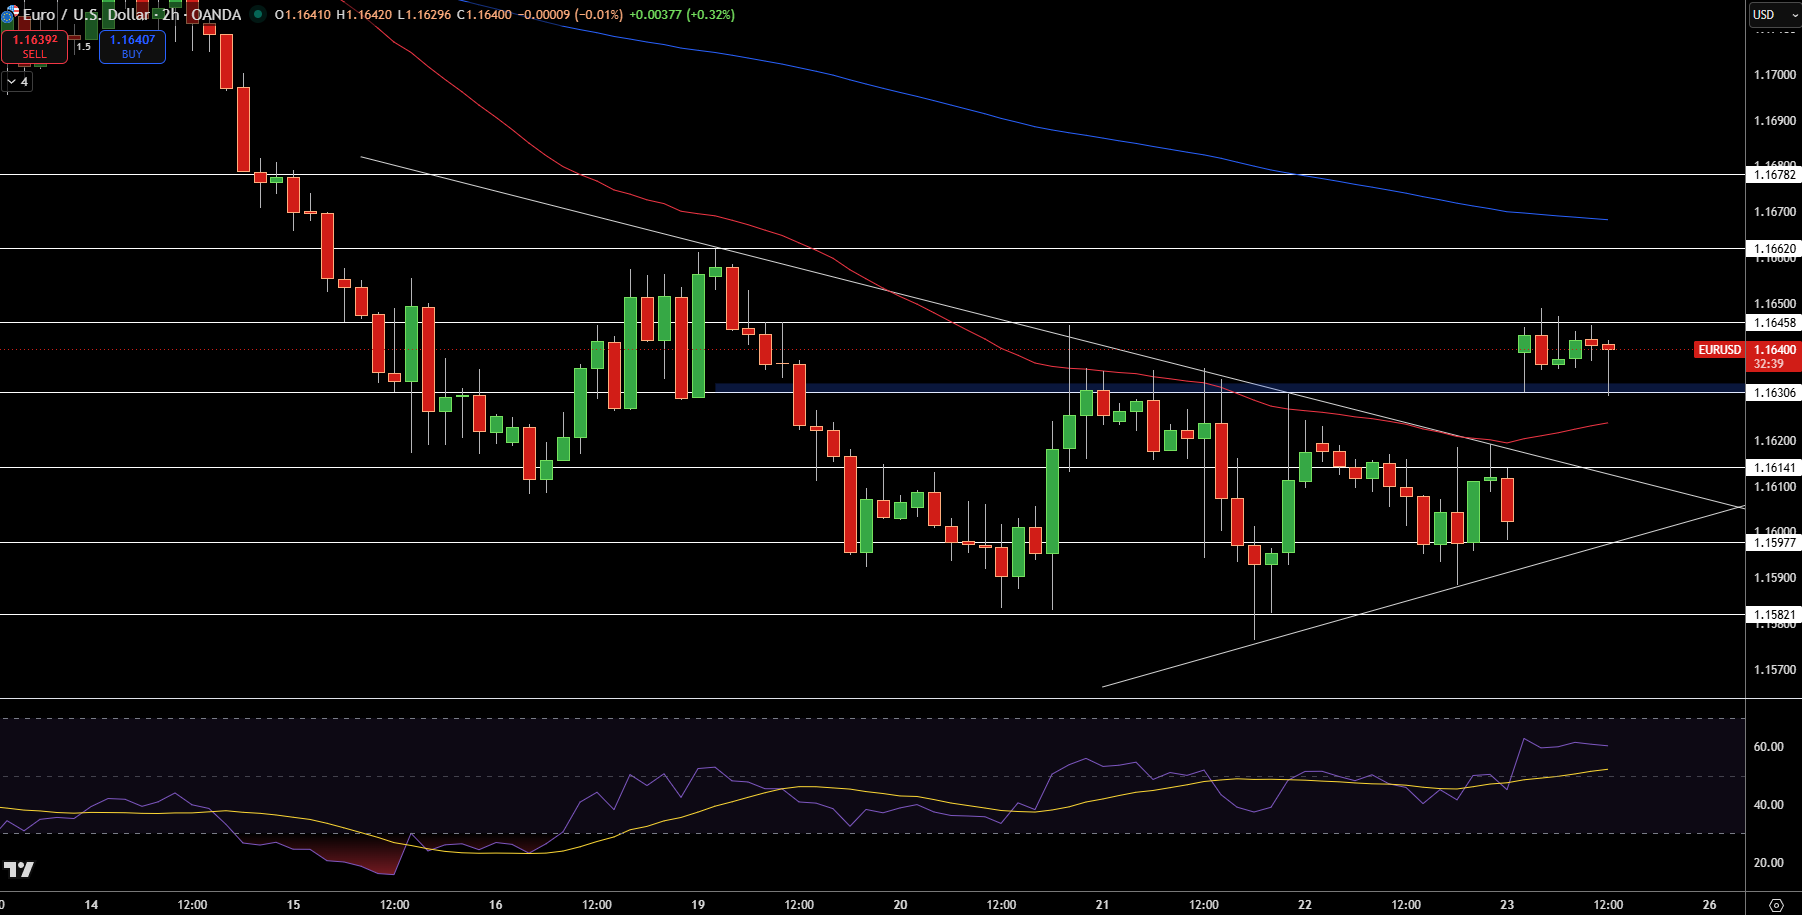
EUR/USD is at $1.1604 on 2h candles while trading under the white descending trendline at $1.166 and the red MA in an attempt to break out from a blue ascending trendline at $1.158 while rejecting the white descending trendline. There is red wicks selling lower highs as the RSI is just below 50 showing price may still decline.
Red MA near $1.166 is resistance while there is more supply at $1.162 on a volume profile. Structure is bearish at the moment, though it is inside a blue rising trendline which is at $1.158 to $1.156 which is near-term support.
The next support at $1.158 to $1.156 Fib confluence. The volume profile identifies $1.162 as heavy supply zone. Structure is bearish as it trades below $1.166 and inside the blue rising trendline.
Trade Idea: Sell $1.1604 to $1.156, Stop $1.164.


