
Advertisement
Advertisement
US ISM Services PMI Climbs to Six-Month High; Dollar Climbs
By:
The dollar traded higher following the latest US services data, which has landed the US Dollar Index at the doorstep of daily resistance.

Services Sector Activity Increases
The Institute for Supply Management (ISM) revealed that US services sector activity jumped in August, hitting 54.5—and recording a six-month pinnacle comfortably north of the median forecast of 52.5 and up from 52.7 in July. This marks an eighth consecutive month in expansionary territory for the services PMI.
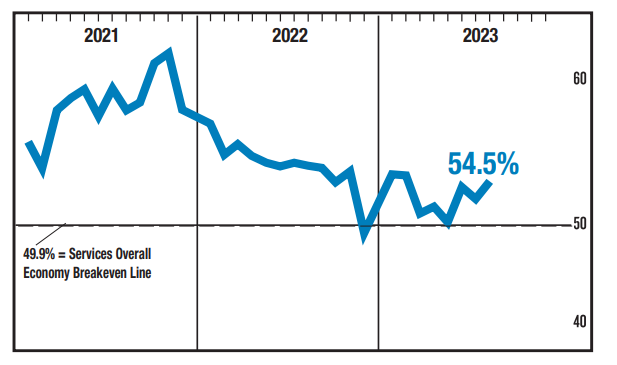
Anthony Nieves, Chair of the Institute for Supply Management, commented: ‘There has been an increase in the rate of growth for the services sector, reflected by increases in all four subindexes that directly factor into the composite Services PMI and faster supplier deliveries. Sentiment among Business Survey Committee respondents varies by industry; however, the majority of panelists are positive about business and economic conditions’.
When asked in a Bloomberg interview whether the Fed has a grip on inflation (given the Prices Paid subindex jumped to 58.9 in August, up from 56.8 in July), Nieves directed the interviewer to one of the ISM survey’s respondents who thought they [the Fed] were doing a ‘great job’ in taming inflation.
The target range probabilities for the Fed rate decision on 20 September remain largely unmoved following the release, with the market all but fully pricing a no-change (current target rate: 5.25%-5.50%).
Where Does This Leave the Greenback?
The aftermath of the services data guided the US Dollar Index northbound (sending major peers lower, such as Europe’s single currency and the British pound, with the former extending losses south of its 200-day SMA and the latter approaching the upper boundary of its 200-day SMA).
The Dollar Index is now on the doorstep of a notable resistance on the daily timeframe at 105.04, which may step into the frame tomorrow. This follows last week’s almost picture-perfect rebound from its 200-day simple moving average in the shape of a bullish engulfing candle on the daily chart. Technically, this was an expected move, according to this week’s Weekly Market Insight, where the Research Team highlighted that the monthly chart had ample room to stretch its legs and nudge higher.
Dollar Index: Monthly and Daily Charts
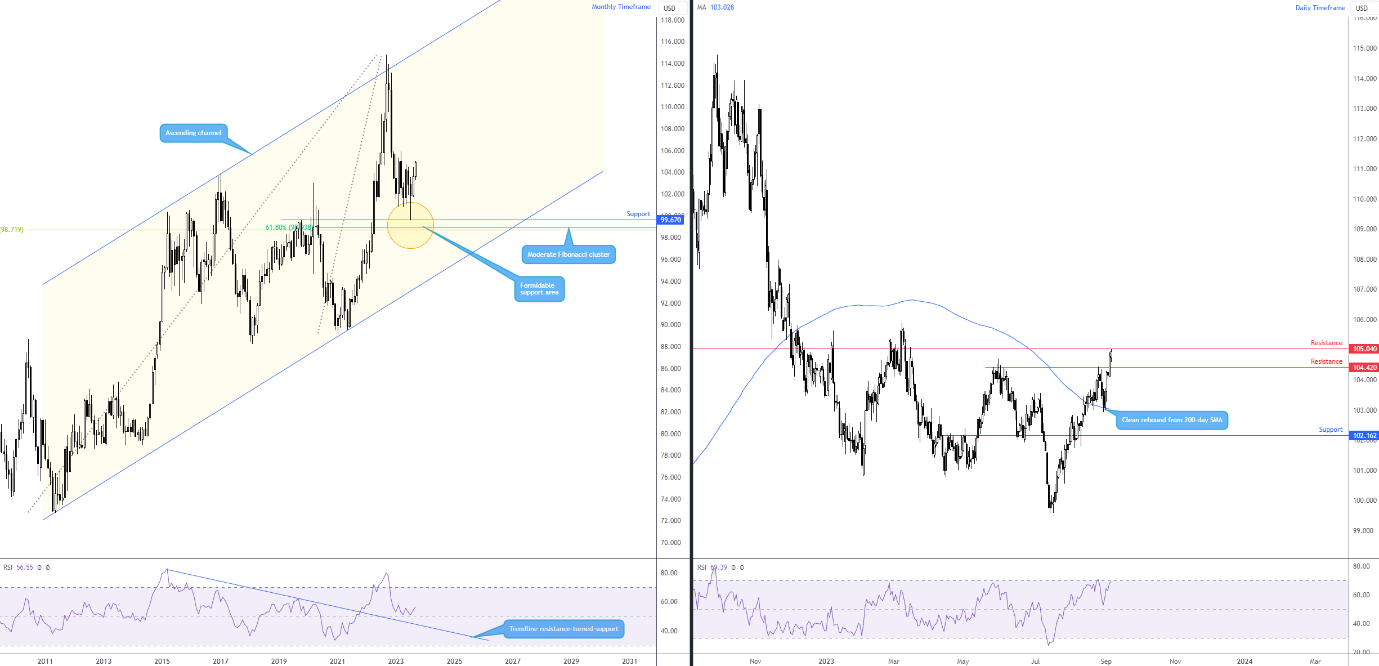
Charts: TradingView
DISCLAIMER:
The information contained in this material is intended for general advice only. It does not take into account your investment objectives, financial situation or particular needs. FP Markets has made every effort to ensure the accuracy of the information as at the date of publication. FP Markets does not give any warranty or representation as to the material. Examples included in this material are for illustrative purposes only. To the extent permitted by law, FP Markets and its employees shall not be liable for any loss or damage arising in any way (including by way of negligence) from or in connection with any information provided in or omitted from this material. Features of the FP Markets products including AAPLicable fees and charges are outlined in the Product Disclosure Statements available from FP Markets website, www.fpmarkets.com and should be considered before deciding to deal in those products. Derivatives can be risky; losses can exceed your initial payment. FP Markets recommends that you seek independent advice. First Prudential Markets Pty Ltd trading as FP Markets ABN 16 112 600 281, Australian Financial Services License Number 286354.
About the Author
Aaron Hillcontributor
Aaron graduated from the Open University and pursued a career in teaching, though soon discovered a passion for trading, personal finance and writing.


Advertisement