



We see USD index turning down, so it might have been a buy the rumor sell the news impact about what we talked about in our past updates.
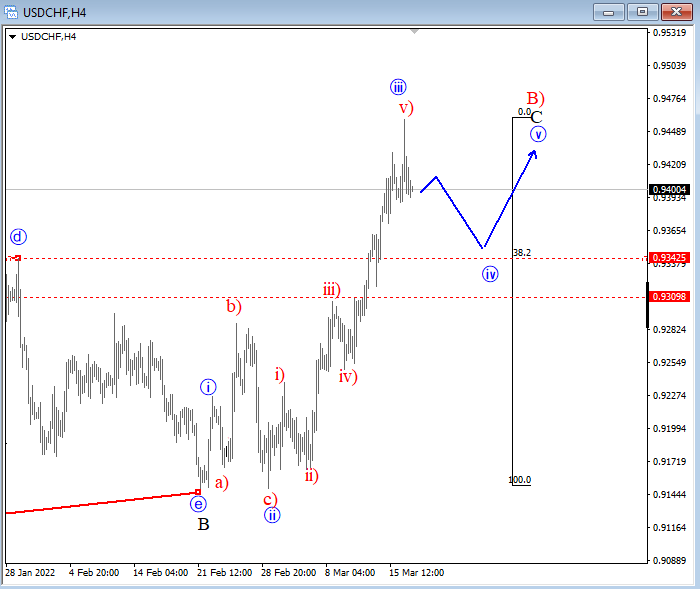
USDCHF Elliott Wave Analysis
USDCHF stabilized at the lower side of a big triangle range back in February and is currently turning higher, breaking resistance levels, so it appears that wave C of B) is still in play possibly to 0.950 area which can be seen after sub wave four pullback when looking at 4h chart. Support is at a former high, and at 38.2%, near 0.93-0.9340.
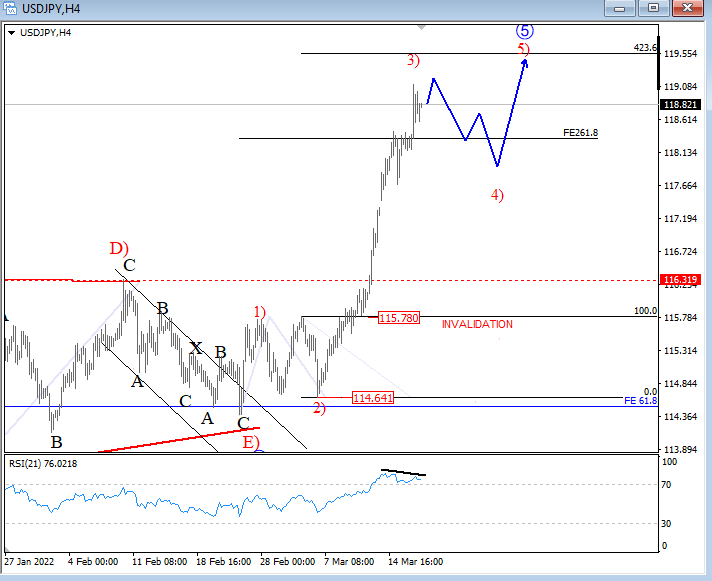
USDJPY Elliott Wave Analysis
USDJPY is coming higher as expected, now breaking out of a triangle, meaning that the pair can be in the final piece of a higher degree impulse from 2021 swing lows. We see this as a fifth wave meaning that upside can be limited in upcoming weeks, but based on Fib projections there is still room for 119.00/50 area after pullbacks. Ideally, next pullback will be wave 4) as we see wave 3) now as very strong and extended leg, so the market may slow down a bit in the near term.
US Dollar Index Price Forecast
Every new US Dollar Index analysis as it publishes, today's technical signal and key levels, live price — on one page.
See all US Dollar Index forecastsFor a look at all of today’s economic events, check out our economic calendar.