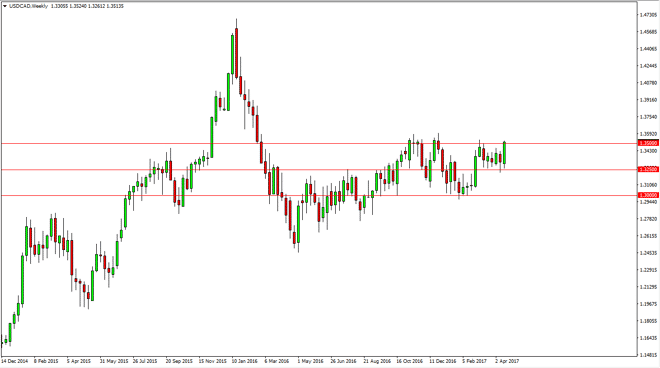
The USD/CAD pair initially fell during the week but found enough support at the 1.3250 level to turn things around and form a very impulsive looking green
The USD/CAD pair initially fell during the week but found enough support at the 1.3250 level to turn things around and form a very impulsive looking green candle. If we can break above the 1.36 handle, we are then free to go much higher, possibly as high as 1.45. Because of this, this might be the “sleeper trade” of the next few months. A break above 1.36 has me buying hand over fist, especially if the oil markets start to roll over again, which look likely to do so.
Chris is a proprietary trader with more than 20 years of experience across various markets, including currencies, indices and commodities. As a senior analyst at FXEmpire since the website’s early days, he offers readers advanced market perspectives to navigate today’s financial landscape with confidence.