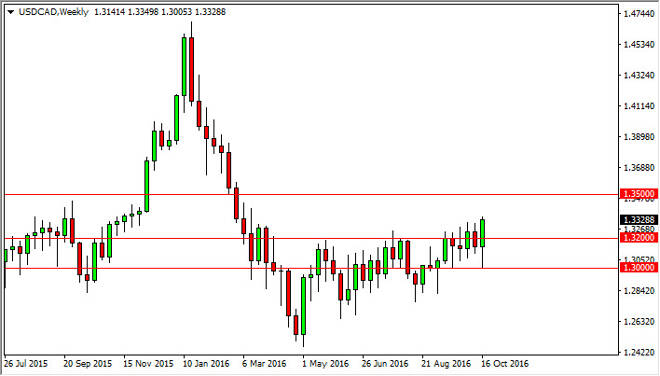
The USD/CAD pair initially fell during the course of the week, but found the 1.30 level below to be far too supportive, and we bounced enough to form a
The USD/CAD pair initially fell during the course of the week, but found the 1.30 level below to be far too supportive, and we bounced enough to form a massive hammer. A break above the top the hammer would be a bullish sign, perhaps reaching towards the 1.35 level given enough momentum and patience. I believe that short-term pullbacks continue to offer buying opportunities as well, and with this I am bullish and will most certainly continue to be bullish when oil markets fall as they do look like they are ready to roll over.
Chris is a proprietary trader with more than 20 years of experience across various markets, including currencies, indices and commodities. As a senior analyst at FXEmpire since the website’s early days, he offers readers advanced market perspectives to navigate today’s financial landscape with confidence.